🥇 #GOLD/#NIFTY Ratio (Yearly Chart)
📊 What Is the GOLD/NIFTY Ratio?
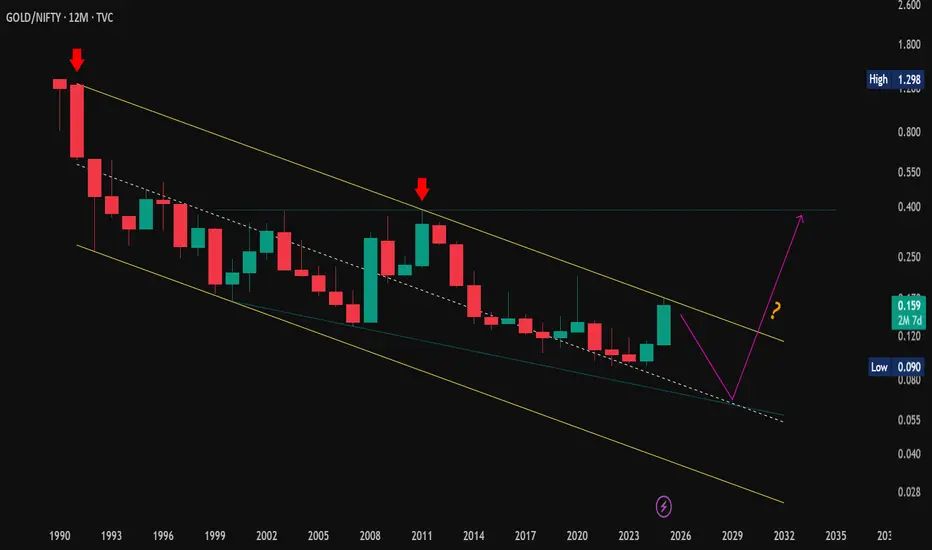
This ratio tracks how Gold performs vs. Indian equities (NIFTY) over time.
📈 Ratio ⬆️ → Gold outperforming NIFTY
📉 Ratio ⬇️ → NIFTY outperforming Gold
📍 Current Market Setup:
Trading inside a long-term falling channel (35 years) - consistent lower highs & lower lows
Recently made a strong rebound from the lower boundary, but the LH–LL structure remains valid
📈 Trend Insight:
✅ Primary Trend: Long-term downtrend (favoring equities)
⚠️ Short-Term: Momentum turning positive — possible medium-term Gold strength
💡 Still below major resistance, so reversal not yet confirmed
🧭 Possible Scenarios:
✅ Continued bounce → Gold may outperform for a while
❌ Rejection from channel top → NIFTY likely resumes dominance
⏳ Neutral for now → Watch for breakout or rejection from top of the falling channel
🏁 Macro Takeaway:
The GOLD/NIFTY ratio sits at a critical long-term zone.
A breakout could mark a major rotation from equities to Gold, while rejection keeps the equity uptrend intact.
Smart investors can use this ratio to balance equity vs. Gold exposure over long cycles. ⚖️
#GoldVsEquity | #NiftyVsGold | #AssetAllocation | #InvestSmart | #Nifty50 | #GoldInvestment | #TechnicalAnalysis | #MarketTrends | #WealthBuilding | #LongTermInvesting
📊 What Is the GOLD/NIFTY Ratio?
This ratio tracks how Gold performs vs. Indian equities (NIFTY) over time.
📈 Ratio ⬆️ → Gold outperforming NIFTY
📉 Ratio ⬇️ → NIFTY outperforming Gold
📍 Current Market Setup:
Trading inside a long-term falling channel (35 years) - consistent lower highs & lower lows
Recently made a strong rebound from the lower boundary, but the LH–LL structure remains valid
📈 Trend Insight:
✅ Primary Trend: Long-term downtrend (favoring equities)
⚠️ Short-Term: Momentum turning positive — possible medium-term Gold strength
💡 Still below major resistance, so reversal not yet confirmed
🧭 Possible Scenarios:
✅ Continued bounce → Gold may outperform for a while
❌ Rejection from channel top → NIFTY likely resumes dominance
⏳ Neutral for now → Watch for breakout or rejection from top of the falling channel
🏁 Macro Takeaway:
The GOLD/NIFTY ratio sits at a critical long-term zone.
A breakout could mark a major rotation from equities to Gold, while rejection keeps the equity uptrend intact.
Smart investors can use this ratio to balance equity vs. Gold exposure over long cycles. ⚖️
#GoldVsEquity | #NiftyVsGold | #AssetAllocation | #InvestSmart | #Nifty50 | #GoldInvestment | #TechnicalAnalysis | #MarketTrends | #WealthBuilding | #LongTermInvesting
Pubblicazioni correlate
Declinazione di responsabilità
Le informazioni e le pubblicazioni non sono intese come, e non costituiscono, consulenza o raccomandazioni finanziarie, di investimento, di trading o di altro tipo fornite o approvate da TradingView. Per ulteriori informazioni, consultare i Termini di utilizzo.