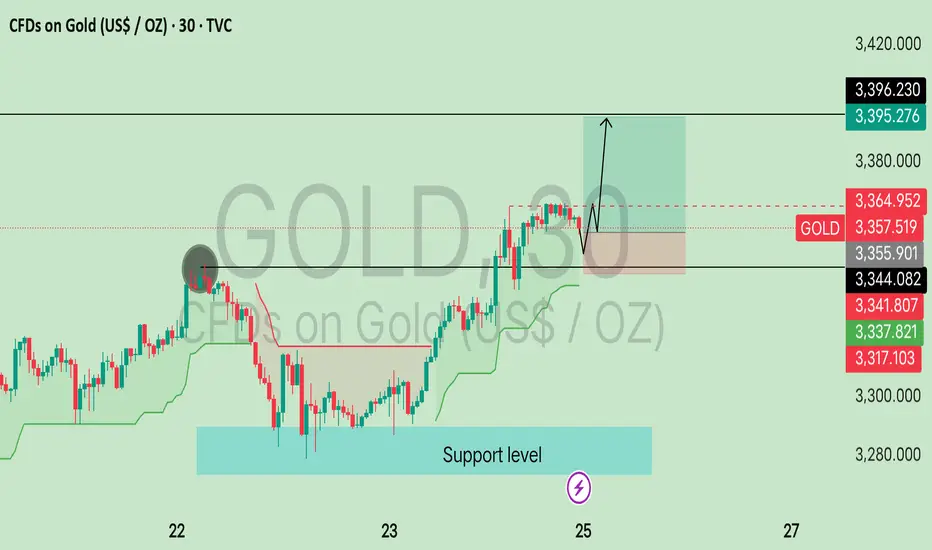
This chart shows the price action of Gold (XAU/USD) on the 30-minute timeframe using TradingView. Here's a breakdown of what the chart indicates:
---
Key Elements:
1. Price Level:
Current price: $3,357.519 per ounce
Price is up +62.852 (+1.91%), indicating a strong recent bullish move.
2. Support Level:
A blue highlighted box labeled “Support level” around the $3,317–$3,338 range shows a key area where price previously found buying interest and bounced back up.
3. Resistance & Breakout:
There's a horizontal black resistance line just above $3,355.901.
The price has broken above this resistance, which is a bullish signal.
4. Bullish Projection:
There’s a black arrow projection, suggesting a possible pullback (retest) to the broken resistance (now support) followed by a continuation upward.
The projected target zone is near $3,396.230.
5. Price Zones:
Green and red price zones on the right show potential entry (buy) and stop-loss levels, supporting the idea of a long (buy) trade setup.
Declinazione di responsabilità
Le informazioni ed i contenuti pubblicati non costituiscono in alcun modo una sollecitazione ad investire o ad operare nei mercati finanziari. Non sono inoltre fornite o supportate da TradingView. Maggiori dettagli nelle Condizioni d'uso.
Declinazione di responsabilità
Le informazioni ed i contenuti pubblicati non costituiscono in alcun modo una sollecitazione ad investire o ad operare nei mercati finanziari. Non sono inoltre fornite o supportate da TradingView. Maggiori dettagli nelle Condizioni d'uso.