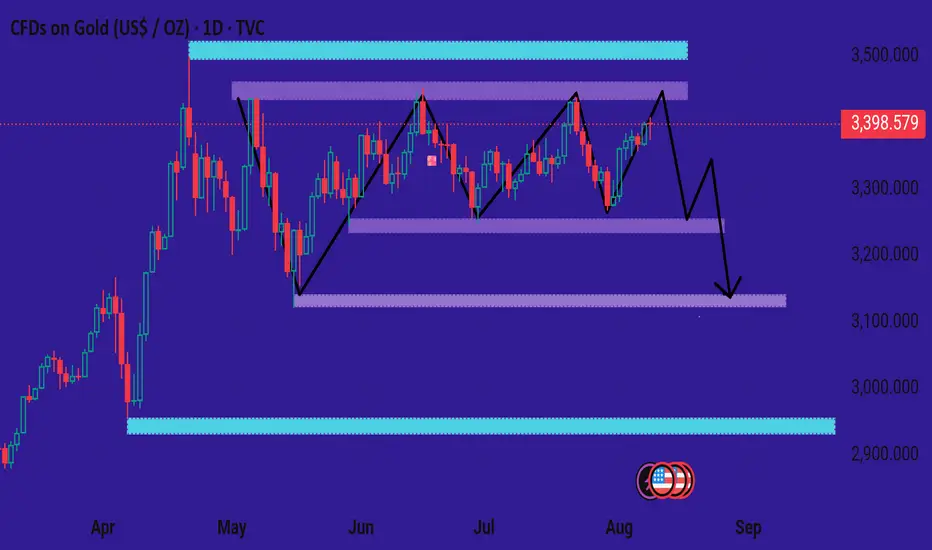
Your chart shows gold (XAU/USD) in a broad horizontal range between roughly $3,220 (support) and $3,460 (resistance), with price currently near the upper zone (~$3,398).
Here’s the breakdown:
Pattern: A sideways range with multiple swings between the two zones, marked by the zigzag black lines.
Current move: The price is at the top of the range after several oscillations, suggesting potential resistance pressure.
Projection: Your drawing shows a bearish scenario—expecting a drop from near resistance, breaking mid-range support ($3,050–$3,100).
Measured move: The highlighted blue vertical bars suggest a projected drop of around $394 (≈ 11.65%), mirroring prior range height.
Key zones:
Resistance: $3,440–$3,460 (upper purple + blue zone)
Mid-support: $3,300–$3,320
Major support: $3,050–$3,100
This looks like a range top rejection setup, anticipating a downward swing to retest range lows unless bulls break above $3,460 with strong momentum.
If you want, I can also mark exact entry, stop-loss, and target levels based on this setup.
t.me/forexxauusdtrading44
Join telegram channel free
t.me/forexxauusdtrading44
Join telegram channel free
t.me/forexxauusdtrading44
Declinazione di responsabilità
Le informazioni ed i contenuti pubblicati non costituiscono in alcun modo una sollecitazione ad investire o ad operare nei mercati finanziari. Non sono inoltre fornite o supportate da TradingView. Maggiori dettagli nelle Condizioni d'uso.
t.me/forexxauusdtrading44
Join telegram channel free
t.me/forexxauusdtrading44
Join telegram channel free
t.me/forexxauusdtrading44
Declinazione di responsabilità
Le informazioni ed i contenuti pubblicati non costituiscono in alcun modo una sollecitazione ad investire o ad operare nei mercati finanziari. Non sono inoltre fornite o supportate da TradingView. Maggiori dettagli nelle Condizioni d'uso.