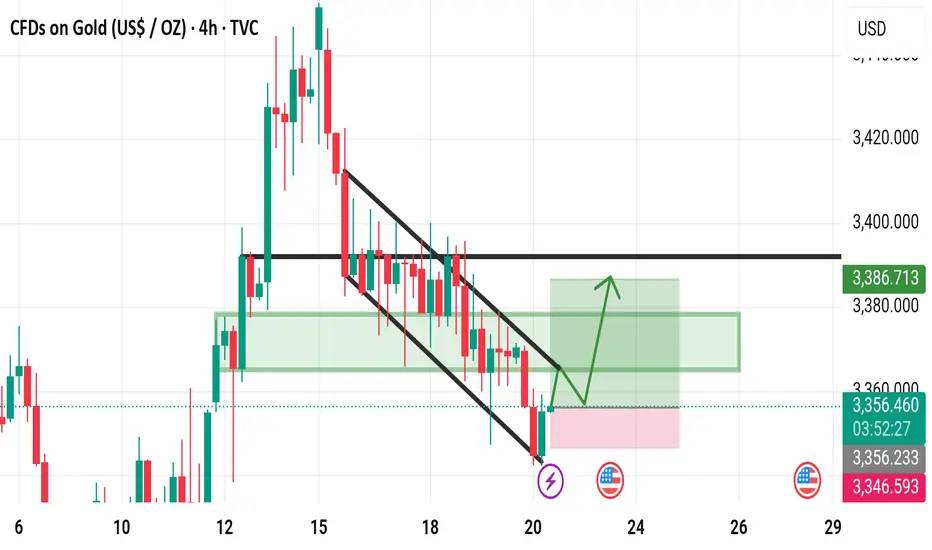
📊 Gold (XAUUSD) 4H Chart Overview
🔻 Current Trend:
Gold has been moving within a clear downward channel, forming consistent lower highs and lower lows.
🟩 Support Zone:
The price is reacting near the key support area between 3346 – 3356, where buyers might step in.
📈 Potential Breakout:
A possible breakout above the descending channel could lead price action toward the 3386 resistance zone.
💡 Key Levels to Watch:
• Resistance: 3386
• Mid-Level: 3356
• Support: 3346
⚠️ What to Look For:
Watch for confirmation of the breakout and how price behaves around the support zone — holding above it could signal further bullish momentum.
🌟 Scenario Idea:
If support holds, gold may attempt to push through the channel and target higher levels, starting with 3356 and potentially reaching 3386.
Declinazione di responsabilità
Le informazioni ed i contenuti pubblicati non costituiscono in alcun modo una sollecitazione ad investire o ad operare nei mercati finanziari. Non sono inoltre fornite o supportate da TradingView. Maggiori dettagli nelle Condizioni d'uso.
Declinazione di responsabilità
Le informazioni ed i contenuti pubblicati non costituiscono in alcun modo una sollecitazione ad investire o ad operare nei mercati finanziari. Non sono inoltre fornite o supportate da TradingView. Maggiori dettagli nelle Condizioni d'uso.
