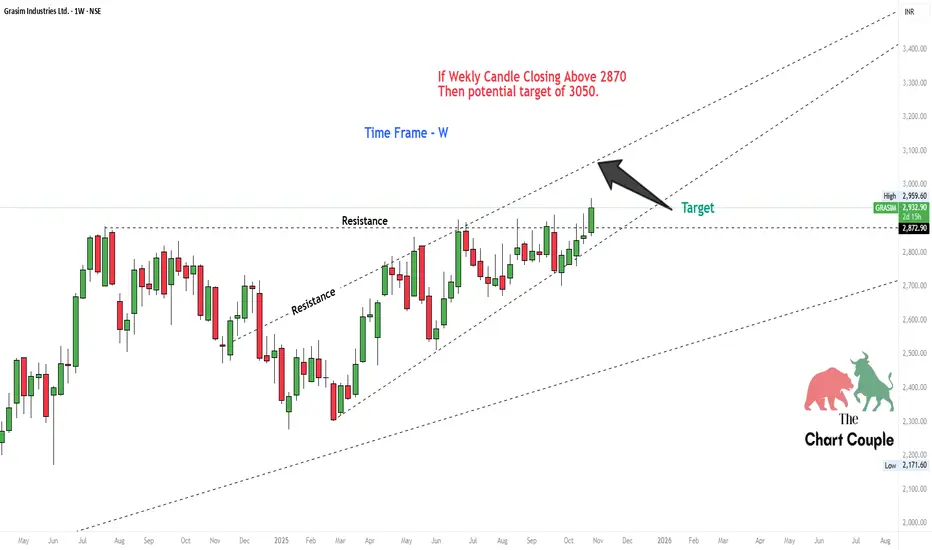
The stock is showing strong momentum within its rising channel!
📈 Key Level to Watch:
If the weekly candle closes above 2870, it could open the gates toward a potential target of 3050.
🧠 Technical View:
Price breaking past resistance zone
Volume confirmation could add strength
Trend remains bullish within channel
⚠️ Keep an eye on the weekly close — a confirmed breakout can bring solid upside momentum!
💬 What’s your view on GRASIM’s next move — breakout or pullback?
#grasim #technicalanalysis #stockmarketindia #nifty50 #priceactiontrading #thechartcouple #indianstocks #chartanalysis #stockbreakout #tradingview #swingtrading #marketanalysis
Declinazione di responsabilità
Le informazioni e le pubblicazioni non sono intese come, e non costituiscono, consulenza o raccomandazioni finanziarie, di investimento, di trading o di altro tipo fornite o approvate da TradingView. Per ulteriori informazioni, consultare i Termini di utilizzo.
Declinazione di responsabilità
Le informazioni e le pubblicazioni non sono intese come, e non costituiscono, consulenza o raccomandazioni finanziarie, di investimento, di trading o di altro tipo fornite o approvate da TradingView. Per ulteriori informazioni, consultare i Termini di utilizzo.