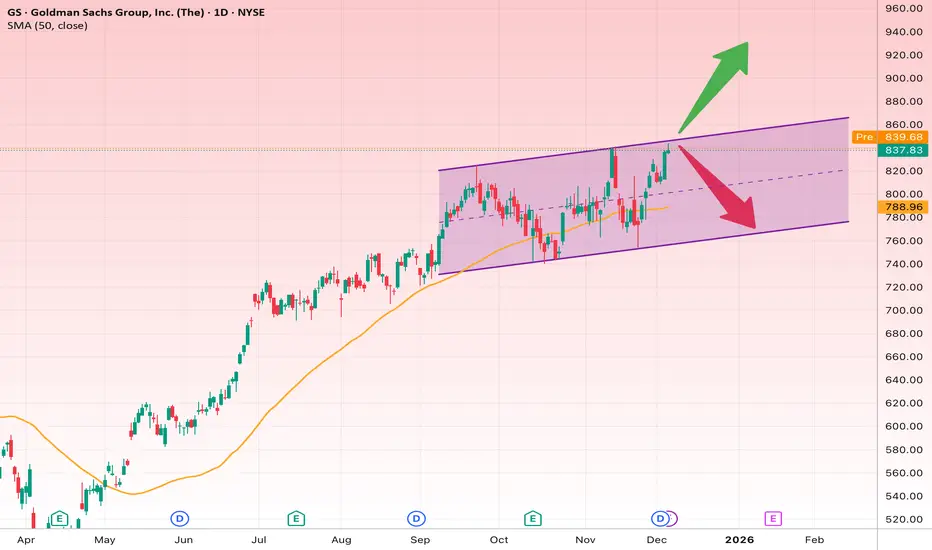
GS is currently moving inside a well-defined ascending channel and has once again reached the upper half of the channel, a key decision zone that will determine the next major move.
• Overall trend: Bullish
• Structure: Ascending channel + dynamic support from the 50-day SMA
• Current status: Testing the upper boundary — potential breakout or pullback zone
Bullish Scenario (more likely if it holds above resistance)
If GS can break and hold above 840, it signals a clean breakout from the channel top and opens the door for a fresh upward rally.
Bullish Targets
• Target 1: 865
• Target 2: 895
• Target 3 (strong breakout): 920
Confirmation
• Daily close above 840
• Rising volume on the breakout
Bearish Scenario (rejection from channel resistance)
If GS fails to break above the channel and gets rejected, a pullback toward the mid-range or bottom of the channel is natural.
Bearish / Correction Targets
• Target 1: 815
• Target 2: 800
• Target 3 (channel bottom): 785
Stop-Loss Levels
Depending on trading style:
• Safer stop-loss for long positions: Below 815
• Aggressive stop-loss: Below 828
(A breakdown below these levels indicates short-term structure failure.)
Quick Fundamental Note
• Recent earnings have shown strong growth, especially in investment banking and asset management.
• Operating expenses are controlled and profit margins improving.
• Market conditions and increased capital markets activity favor GS.
These fundamentals support the bullish technical bias.
Declinazione di responsabilità
Le informazioni e le pubblicazioni non sono intese come, e non costituiscono, consulenza o raccomandazioni finanziarie, di investimento, di trading o di altro tipo fornite o approvate da TradingView. Per ulteriori informazioni, consultare i Termini di utilizzo.
Declinazione di responsabilità
Le informazioni e le pubblicazioni non sono intese come, e non costituiscono, consulenza o raccomandazioni finanziarie, di investimento, di trading o di altro tipo fornite o approvate da TradingView. Per ulteriori informazioni, consultare i Termini di utilizzo.