## 🚀 GE Vernova T\&D India – Q1 FY26 RESULTS + CHART ANALYSIS
### 🔹 Fundamentals (Q1 FY26 – ended June 30, 2025)
* **Revenue**: ₹1,330 Cr, up **39% YoY** (₹958 Cr in Jun 2024)
* **EBITDA**: ₹388 Cr, up **113% YoY**, margin expansion to \~29%
* **Net Profit**: ₹291 Cr, up **116% YoY**
* **EPS**: ₹11.37 vs ₹5.25 last year
* **Order Bookings**: ₹1,620 Cr (+57% YoY) → strong visibility
**Management View**: Growth supported by India’s **grid modernization**, selective high-margin orders, and strong execution. Free cash flow remains healthy.
---
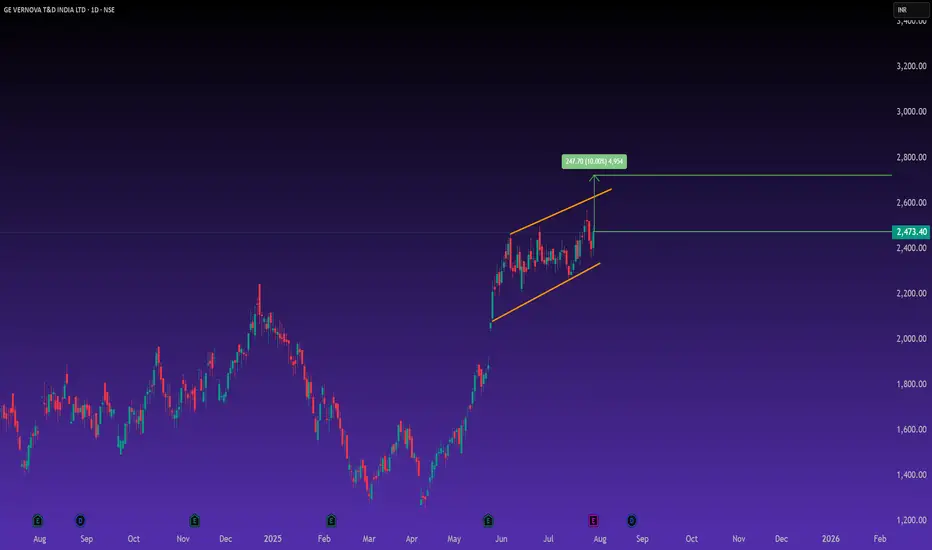
### 📈 Technical Setup
* Stock trading in an **upward channel** since June.
* Current Price: **₹2,476**
* **Resistance**: \~₹2,500 → breakout level.
* **Support**: ₹2,420–2,430.
* **Upside Target**: ₹2,700–2,750 (≈10% potential) if breakout sustains.
* Bias remains **bullish** above support.
---
### ⚙️ Broader Catalysts
* Big contract win for 765 kV transformers & shunt reactors from **POWERGRID**, deliveries from 2026.
* Part of global **GE Vernova Electrification segment**, benefiting from AI/data center energy demand + renewable integration.
* Valuations remain rich (PE \~83), but growth visibility keeps investor confidence high.
---
### 🧭 Levels to Watch
| Parameter | Level |
| --------- | ------------ |
| Support | ₹2,420–2,430 |
| Breakout | ₹2,500 |
| Target | ₹2,700–2,750 |
| Risk Zone | Below ₹2,400 |
---
✅ **Conclusion**: GE Vernova T\&D posted **stellar earnings** with strong margins and a robust order pipeline. Technically, a breakout above ₹2,500 could lead to the next leg higher. The company is well-placed to ride India’s power grid and renewable push.
---
⚠️ **Disclaimer**: This analysis is for **educational and informational purposes only**. It is **not investment advice** or a stock recommendation. Please **do your own research (DYOR)** or consult a SEBI-registered advisor before making any investment decisions
Declinazione di responsabilità
Le informazioni ed i contenuti pubblicati non costituiscono in alcun modo una sollecitazione ad investire o ad operare nei mercati finanziari. Non sono inoltre fornite o supportate da TradingView. Maggiori dettagli nelle Condizioni d'uso.
Declinazione di responsabilità
Le informazioni ed i contenuti pubblicati non costituiscono in alcun modo una sollecitazione ad investire o ad operare nei mercati finanziari. Non sono inoltre fornite o supportate da TradingView. Maggiori dettagli nelle Condizioni d'uso.