RSI positive divergence is a powerful technical analysis signal that indicates a potential trend reversal from bearish to bullish. Here's a simple step-by-step explanation for your community members:
Understand RSI: The Relative Strength Index (RSI) measures the speed and change of price movements on a scale of 0 to 100. Values below 40 typically indicate an oversold market, while values above 60 suggest an overbought market.
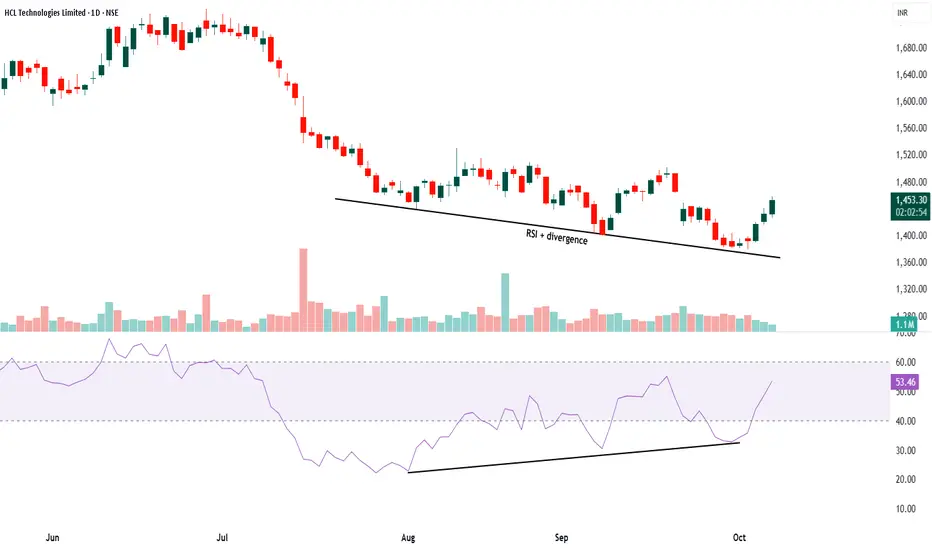
Spot the price trend: Look at the stock price chart. If the price is making lower lows (falling prices) over time, it indicates a downtrend.
Observe the RSI behavior: While the price is making lower lows, check the RSI indicator below the price chart. In RSI positive divergence, the RSI makes higher lows.
What is RSI positive divergence? It's when the price hits new lows, but RSI doesn't follow and instead forms higher lows. This shows weakening selling pressure and suggests buyers may soon take control.
Interpretation: RSI positive divergence signals the existing downtrend may be losing momentum, making it likely for the price to reverse upwards.
Confirmation: Traders often wait for additional bullish signals or a price breakout to confirm the reversal before entering long positions.
Understand RSI: The Relative Strength Index (RSI) measures the speed and change of price movements on a scale of 0 to 100. Values below 40 typically indicate an oversold market, while values above 60 suggest an overbought market.
Spot the price trend: Look at the stock price chart. If the price is making lower lows (falling prices) over time, it indicates a downtrend.
Observe the RSI behavior: While the price is making lower lows, check the RSI indicator below the price chart. In RSI positive divergence, the RSI makes higher lows.
What is RSI positive divergence? It's when the price hits new lows, but RSI doesn't follow and instead forms higher lows. This shows weakening selling pressure and suggests buyers may soon take control.
Interpretation: RSI positive divergence signals the existing downtrend may be losing momentum, making it likely for the price to reverse upwards.
Confirmation: Traders often wait for additional bullish signals or a price breakout to confirm the reversal before entering long positions.
Declinazione di responsabilità
Le informazioni e le pubblicazioni non sono intese come, e non costituiscono, consulenza o raccomandazioni finanziarie, di investimento, di trading o di altro tipo fornite o approvate da TradingView. Per ulteriori informazioni, consultare i Termini di utilizzo.
Declinazione di responsabilità
Le informazioni e le pubblicazioni non sono intese come, e non costituiscono, consulenza o raccomandazioni finanziarie, di investimento, di trading o di altro tipo fornite o approvate da TradingView. Per ulteriori informazioni, consultare i Termini di utilizzo.