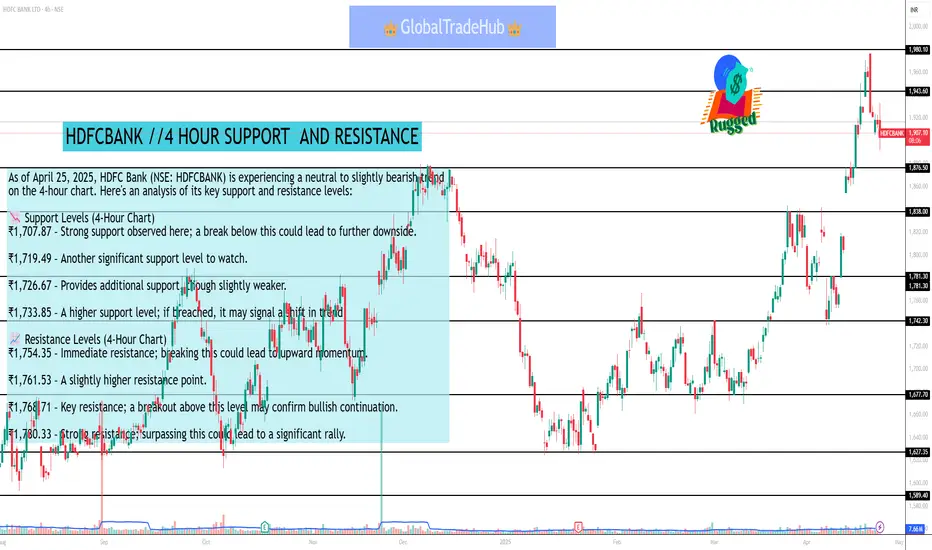
As of April 25, 2025, HDFC Bank (NSE: HDFCBANK) is experiencing a neutral to slightly bearish trend on the 4-hour chart. Here's an analysis of its key support and resistance levels:
📉 Support Levels (4-Hour Chart)
₹1,707.87 – Strong support observed here; a break below this could lead to further downside.
₹1,719.49 – Another significant support level to watch.
₹1,726.67 – Provides additional support, though slightly weaker.
₹1,733.85 – A higher support level; if breached, it may signal a shift in trend.
📈 Resistance Levels (4-Hour Chart)
₹1,754.35 – Immediate resistance; breaking this could lead to upward momentum.
₹1,761.53 – A slightly higher resistance point.
₹1,768.71 – Key resistance; a breakout above this level may confirm bullish continuation.
₹1,780.33 – Strong resistance; surpassing this could lead to a significant rally.
Pubblicazioni correlate
Declinazione di responsabilità
Le informazioni ed i contenuti pubblicati non costituiscono in alcun modo una sollecitazione ad investire o ad operare nei mercati finanziari. Non sono inoltre fornite o supportate da TradingView. Maggiori dettagli nelle Condizioni d'uso.
Pubblicazioni correlate
Declinazione di responsabilità
Le informazioni ed i contenuti pubblicati non costituiscono in alcun modo una sollecitazione ad investire o ad operare nei mercati finanziari. Non sono inoltre fornite o supportate da TradingView. Maggiori dettagli nelle Condizioni d'uso.