STOCK TREND - Sideways to Bullish
MULTI TF ANALYSIS
==================
MONTHLY - Price is trading near ATH
WEEKLY - [2-3] Week Consolidation near ATH
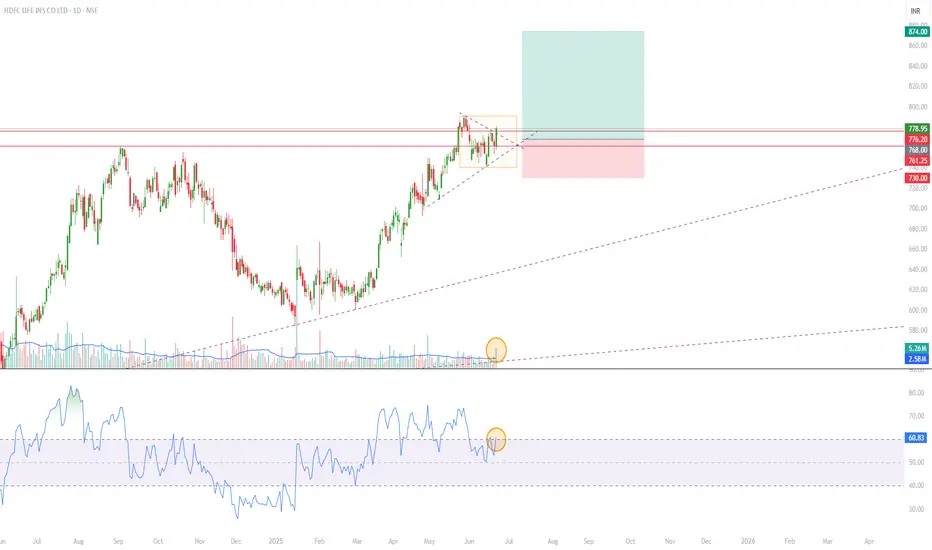
DAILY - Symmentrical Triangle breakout near ATH
TECHNICAL ANALYSIS
===================
Symmentrical Triangle breakout with Volume and RSI confirmation
Stock Price is trading above [50, 100, 200] SMAs
RSI > [60]
VOLUME > [20] MA
Support/Resistance Zone - [761.20 - 775.65]
Demand Zone - NA
FUNDAMENTAL ANALYSIS
======================
Compounded Sales Growth - [-4%]
Compounded Profit Growth - [15%]
Stock Price CAGR - [34%]
Return on Equity - [12%]
Note: The stock is currently little overvalued as Stock PE(92.7) ~ Industry PE(77.3).
TRADE DESIGN
=============
ENTRY - [768]
SL - [730]
TARGET - [874]
RRR - [1:3]+
Disclaimer: This chart study is for educational purpose only. Kindly trade at your own risk.
Declinazione di responsabilità
Le informazioni ed i contenuti pubblicati non costituiscono in alcun modo una sollecitazione ad investire o ad operare nei mercati finanziari. Non sono inoltre fornite o supportate da TradingView. Maggiori dettagli nelle Condizioni d'uso.
Declinazione di responsabilità
Le informazioni ed i contenuti pubblicati non costituiscono in alcun modo una sollecitazione ad investire o ad operare nei mercati finanziari. Non sono inoltre fornite o supportate da TradingView. Maggiori dettagli nelle Condizioni d'uso.