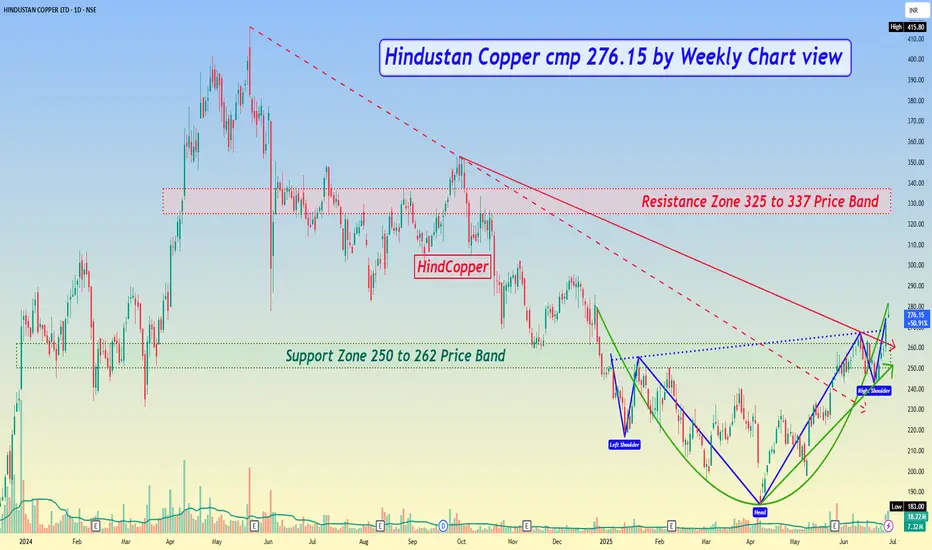
*Hindustan Copper cmp 276.15 by Weekly Chart view*
- Support Zone 250 to 262 Price Band
- Resistance Zone 325 to 337 Price Band
- All major Technical indicators BB, EMA, MACD, RSI trending positively
- Stock is seen trending with positive momentum on Daily and Weekly Charts
- Rising Support Trendline respected with Falling Resistance Trendline Breakout
- Bullish Head & Shoulders pattern within Bullish Rounding Bottom seen completed
- Volumes are getting attractive and spiking heavily above the average traded quantity
- Stock seems to have tested and retested the Support Zone and attempting upwards momentum
Declinazione di responsabilità
Le informazioni e le pubblicazioni non sono intese come, e non costituiscono, consulenza o raccomandazioni finanziarie, di investimento, di trading o di altro tipo fornite o approvate da TradingView. Per ulteriori informazioni, consultare i Termini di utilizzo.
Declinazione di responsabilità
Le informazioni e le pubblicazioni non sono intese come, e non costituiscono, consulenza o raccomandazioni finanziarie, di investimento, di trading o di altro tipo fornite o approvate da TradingView. Per ulteriori informazioni, consultare i Termini di utilizzo.