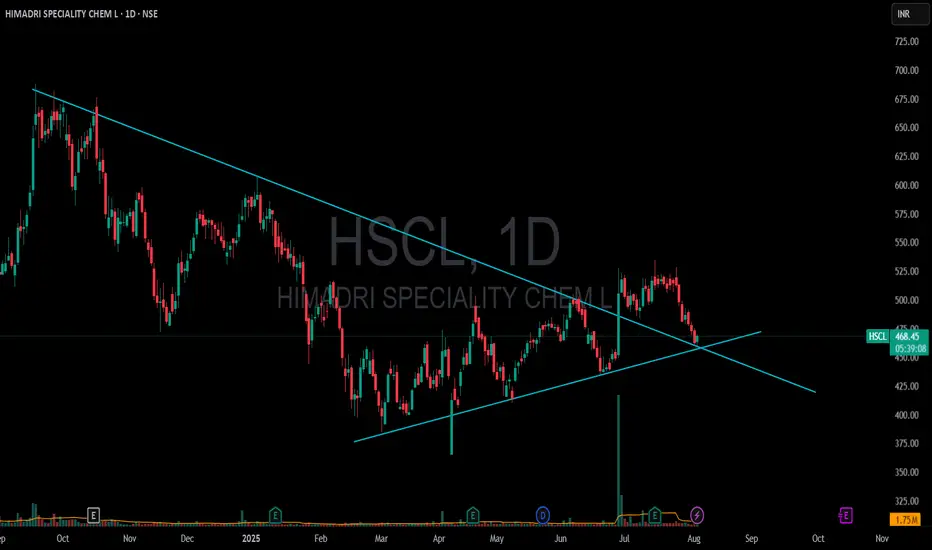
HSCL (Hindustan Steelworks Construction Ltd) is currently trading around ₹467 and you've identified a triangle pattern with a target of ₹900, here’s a brief technical analysis validation and strategy breakdown:
🔺 Triangle Pattern Overview
A triangle pattern (ascending, descending, or symmetrical) typically signals a consolidation before a breakout. If you're seeing a breakout, here's how to approach it:
✅ Trade Setup (Post-Breakout)
Current Price: ₹467
Chart Pattern: Triangle (you didn’t mention if it's symmetrical/ascending/descending – assuming symmetrical)
Breakout Direction: Upward
Target: ₹900
Stop Loss (SL): Just below breakout point or previous swing low (e.g., around ₹430–440, depending on chart)
📏 Target Justification
Measure the height of the triangle at its widest part.
Add that height to the breakout point to calculate the target.
Example:
Triangle base: ₹300 to ₹450 → Height = ₹150
Breakout point = ₹450
Target = ₹450 + ₹150 = ₹600 (conservative)
So ₹900 implies a long-term multi-wave move, or it could be based on logarithmic projection/fundamentals.
📊 Trading Strategy
Signal Level
Entry ₹467 (confirmed breakout above triangle)
Stop Loss ₹430–440 (below last swing or triangle base)
Short-Term Target ₹600–650
Long-Term Target ₹900
Risk:Reward 1:3+
⚠️ Important Notes
Volume confirmation is key during the breakout.
If it's a false breakout, price may fall back into triangle range.
₹900 is almost 2x current price – which suggests either:
A very long-term target
Or influenced by fundamental developments, such as new orders or PSU restructuring news.
Disclaimer: The information provided is for educational and informational purposes only and should not be considered as financial advice. Investing in the stock market involves risk, and past performance is not indicative of future results. Please consult with a certified financial advisor or conduct your own research before making any investment decisions. We are not responsible for any losses incurred as a result of using this information. Stock market investments are subject to market risks; read all related documents carefully.
Declinazione di responsabilità
Le informazioni ed i contenuti pubblicati non costituiscono in alcun modo una sollecitazione ad investire o ad operare nei mercati finanziari. Non sono inoltre fornite o supportate da TradingView. Maggiori dettagli nelle Condizioni d'uso.
Declinazione di responsabilità
Le informazioni ed i contenuti pubblicati non costituiscono in alcun modo una sollecitazione ad investire o ad operare nei mercati finanziari. Non sono inoltre fornite o supportate da TradingView. Maggiori dettagli nelle Condizioni d'uso.