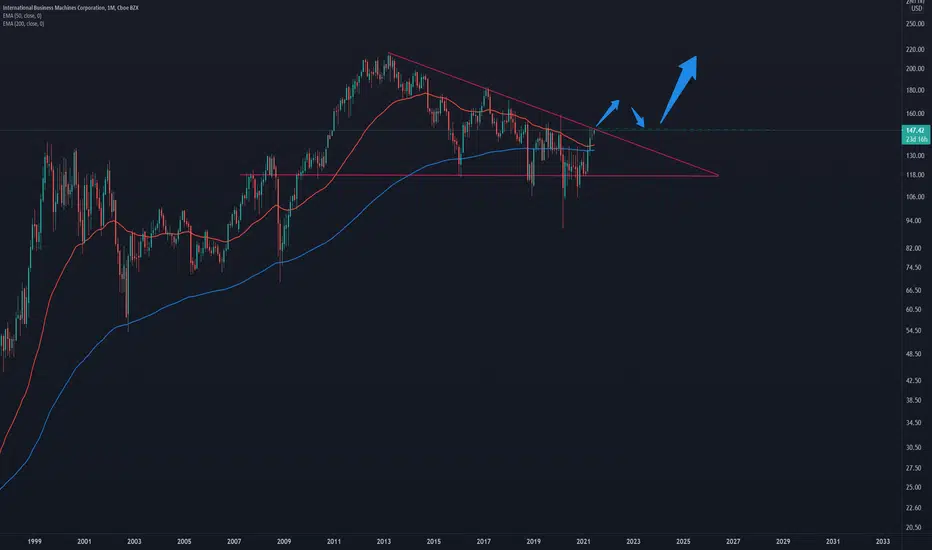
IBM monthly chart is potentially about to breakout of an almost decade long triangle pattern .
50 EMA came down to the 200 EMA and just turned back up.
If it breaks out successfully I would expect prices to go back to the 2013 ATH .
50 EMA came down to the 200 EMA and just turned back up.
If it breaks out successfully I would expect prices to go back to the 2013 ATH .
Declinazione di responsabilità
Le informazioni ed i contenuti pubblicati non costituiscono in alcun modo una sollecitazione ad investire o ad operare nei mercati finanziari. Non sono inoltre fornite o supportate da TradingView. Maggiori dettagli nelle Condizioni d'uso.
Declinazione di responsabilità
Le informazioni ed i contenuti pubblicati non costituiscono in alcun modo una sollecitazione ad investire o ad operare nei mercati finanziari. Non sono inoltre fornite o supportate da TradingView. Maggiori dettagli nelle Condizioni d'uso.