Closing Price: ₹1,363.00
Day's Range: ₹1,357.00 – ₹1,372.70
Previous Close: ₹1,375.80
Volume: 18,342,280 shares traded
Market Cap: ₹971,186 crore
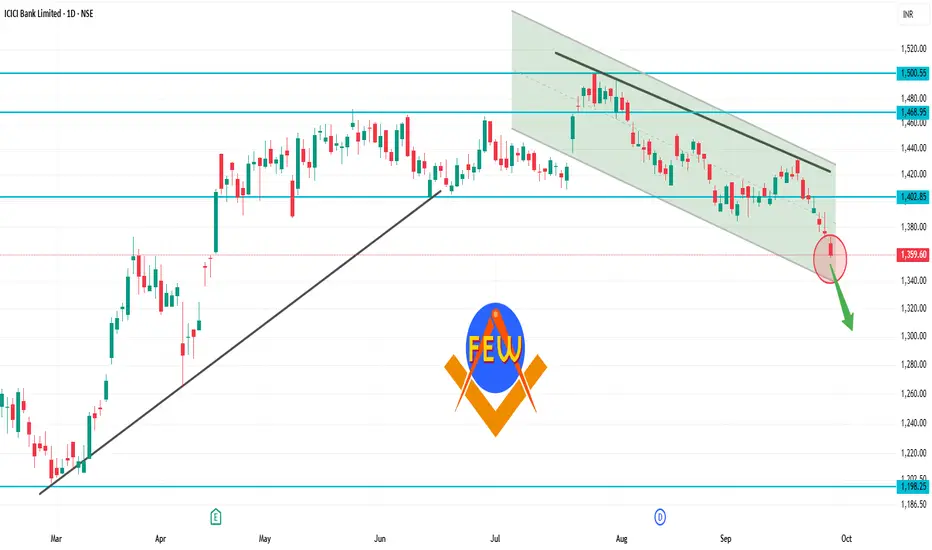
52-Week High: ₹1,500.00
52-Week Low: ₹1,186.00
Face Value: ₹2.00
Beta: 0.90
🧾 Financial Highlights
P/E Ratio (TTM): 18.36
P/B Ratio: 3.12
EPS (TTM): ₹74.04
Dividend Yield: 0.81%
ROE: 17.05%
Book Value: ₹436.56
📈 Technical Insights
Trend: The stock is approaching its 200-day moving average, a key technical indicator. A bounce from this level could signal a buying opportunity, while a breakdown may suggest further downside risk.
Support Levels: ₹1,357.00, ₹1,350.00
Resistance Levels: ₹1,375.00, ₹1,400.00
📌 Key Takeaways
Recent Performance: ICICI Bank's stock declined by 0.91%, underperforming the broader market.
Analyst Sentiment: Despite recent volatility, ICICI Bank remains a top pick among analysts for long-term investment.
Day's Range: ₹1,357.00 – ₹1,372.70
Previous Close: ₹1,375.80
Volume: 18,342,280 shares traded
Market Cap: ₹971,186 crore
52-Week High: ₹1,500.00
52-Week Low: ₹1,186.00
Face Value: ₹2.00
Beta: 0.90
🧾 Financial Highlights
P/E Ratio (TTM): 18.36
P/B Ratio: 3.12
EPS (TTM): ₹74.04
Dividend Yield: 0.81%
ROE: 17.05%
Book Value: ₹436.56
📈 Technical Insights
Trend: The stock is approaching its 200-day moving average, a key technical indicator. A bounce from this level could signal a buying opportunity, while a breakdown may suggest further downside risk.
Support Levels: ₹1,357.00, ₹1,350.00
Resistance Levels: ₹1,375.00, ₹1,400.00
📌 Key Takeaways
Recent Performance: ICICI Bank's stock declined by 0.91%, underperforming the broader market.
Analyst Sentiment: Despite recent volatility, ICICI Bank remains a top pick among analysts for long-term investment.
Pubblicazioni correlate
Declinazione di responsabilità
Le informazioni ed i contenuti pubblicati non costituiscono in alcun modo una sollecitazione ad investire o ad operare nei mercati finanziari. Non sono inoltre fornite o supportate da TradingView. Maggiori dettagli nelle Condizioni d'uso.
Pubblicazioni correlate
Declinazione di responsabilità
Le informazioni ed i contenuti pubblicati non costituiscono in alcun modo una sollecitazione ad investire o ad operare nei mercati finanziari. Non sono inoltre fornite o supportate da TradingView. Maggiori dettagli nelle Condizioni d'uso.