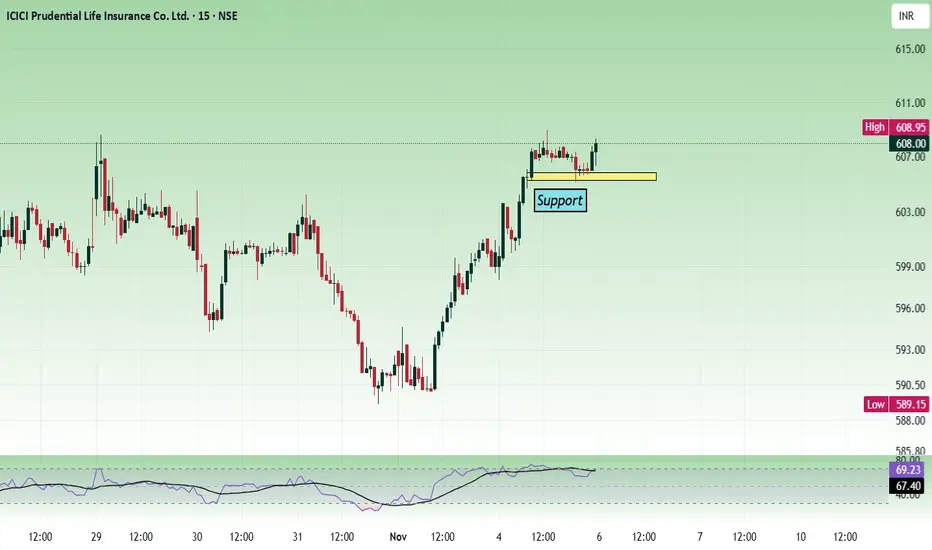
In the lower time frame, the price is taking support from the support zone at 605. The daily time frame shows, the price was consolidating in the range of 580 to 610, and now it is getting ready to give a breakout.

The candle formation in the daily chart is showing strength. Buy above 604 - 606 with the stop loss of 598 for the targets 611, 616, 621, 628 and 634.
This will work if the opening shows bullish strength above 600. Otherwise, the price can continue to move in the range.
Always do your analysis before taking any trade.
Role I play here : Moderator. Follow me in telegram to trade better. t.me/Analysis4Newbie Contact information : tradingplan4u@gmail.com
Declinazione di responsabilità
Le informazioni e le pubblicazioni non sono intese come, e non costituiscono, consulenza o raccomandazioni finanziarie, di investimento, di trading o di altro tipo fornite o approvate da TradingView. Per ulteriori informazioni, consultare i Termini di utilizzo.