Energy Exhausted: Indian Energy Exchange Nears Breakdown
Greetings Fellow Traders, Sharing a critical technical update on Indian Energy Exchange (IEX). The chart is flashing early warning signs of a potential breakdown. Key zones and price action indicate growing bearish momentum stay alert and trade with caution!
Indian Energy Exchange – Bearish Outlook Strengthens.
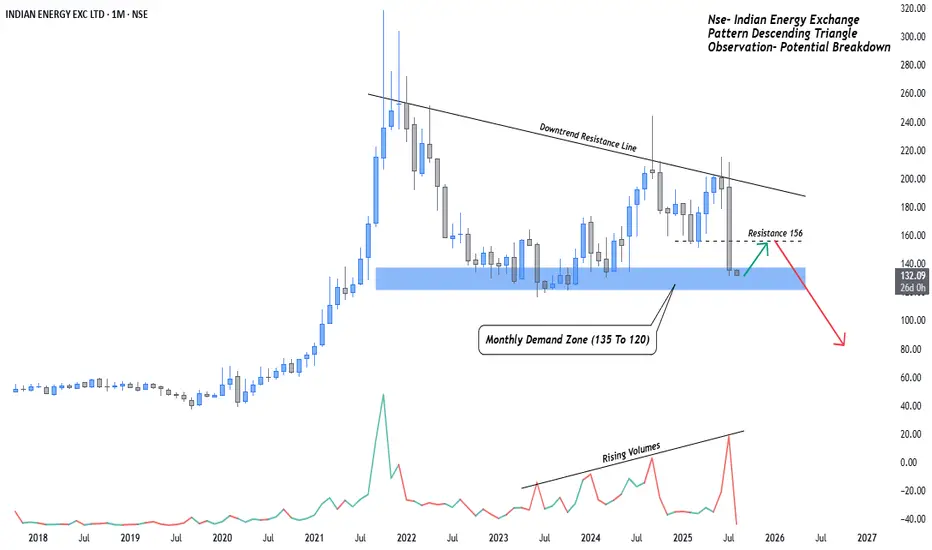
Indian Energy Exchange is showing clear signs of weakness as it continues to respect a long standing downtrend resistance line. The recent price action saw a sharp rejection near the 156 resistance, reinforcing bearish control.
Currently, the stock is testing a crucial Monthly Demand Zone (135–120) a level that has historically offered strong support. However, the structure now suggests increasing vulnerability.
Bearish Signals-:
Price consistently forming lower highs beneath the descending trendline.
Rising volume on red candles signals strengthening selling pressure.
Price nearing the lower boundary of demand, risking a breakdown.
Key Levels to Watch:
Breakdown below 120-: A close below this level, especially with volume confirmation, could trigger a deeper correction toward 70 or lower.
Rejection from 156 zone-: Any bounce back to this level may offer fresh shorting opportunities, unless a trend reversal is confirmed.
A decisive move below 120 would mark the beginning of a markdown phase, validating the broader bearish reversal pattern in play.
This publication I am sharing for learning purpose like price action, Support and resistance and trends ETC.
Regards- Amit
Indian Energy Exchange – Bearish Outlook Strengthens.
Indian Energy Exchange is showing clear signs of weakness as it continues to respect a long standing downtrend resistance line. The recent price action saw a sharp rejection near the 156 resistance, reinforcing bearish control.
Currently, the stock is testing a crucial Monthly Demand Zone (135–120) a level that has historically offered strong support. However, the structure now suggests increasing vulnerability.
Bearish Signals-:
Price consistently forming lower highs beneath the descending trendline.
Rising volume on red candles signals strengthening selling pressure.
Price nearing the lower boundary of demand, risking a breakdown.
Key Levels to Watch:
Breakdown below 120-: A close below this level, especially with volume confirmation, could trigger a deeper correction toward 70 or lower.
Rejection from 156 zone-: Any bounce back to this level may offer fresh shorting opportunities, unless a trend reversal is confirmed.
A decisive move below 120 would mark the beginning of a markdown phase, validating the broader bearish reversal pattern in play.
This publication I am sharing for learning purpose like price action, Support and resistance and trends ETC.
Regards- Amit
Declinazione di responsabilità
Le informazioni ed i contenuti pubblicati non costituiscono in alcun modo una sollecitazione ad investire o ad operare nei mercati finanziari. Non sono inoltre fornite o supportate da TradingView. Maggiori dettagli nelle Condizioni d'uso.
Declinazione di responsabilità
Le informazioni ed i contenuti pubblicati non costituiscono in alcun modo una sollecitazione ad investire o ad operare nei mercati finanziari. Non sono inoltre fornite o supportate da TradingView. Maggiori dettagli nelle Condizioni d'uso.