📈 Key Recent Data & Context
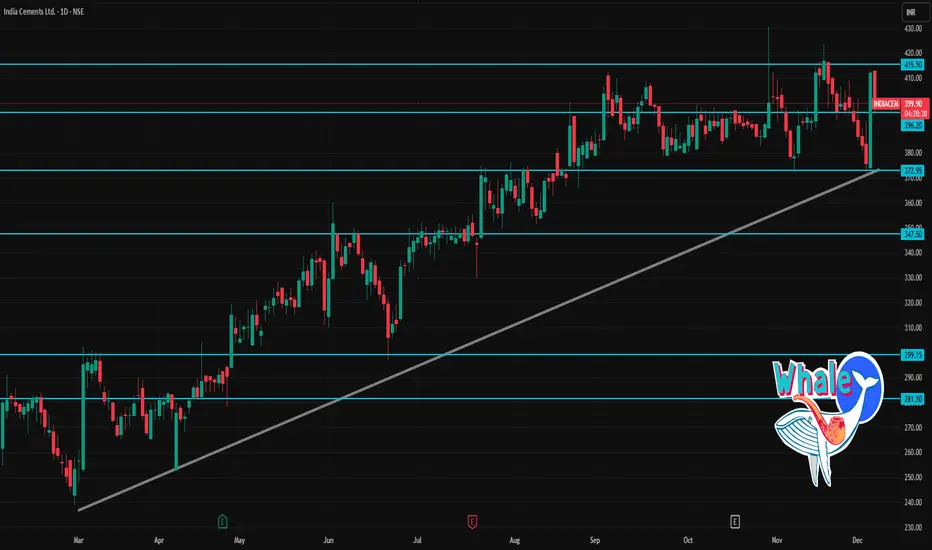
Recent closing price was ~ ₹412.15, with VWAP ~ ₹402.10. That means price closed above VWAP — often seen as a short-term bullish signal.
The stock has experienced a significant volume spike recently (much higher than its 2-week average), which may suggest stronger conviction in current move.
According to one daily technical indicator set, the stock shows “neutral to slightly bullish” — RSI near mid-range, MACD modestly positive.
🔎 1-Day Pivot & Support / Resistance Levels
Using standard pivot-point calculations for INDIACEM:
Level Type Price (₹)
Daily Pivot 364.95
Support 1 (S1) 359.90
Support 2 (S2) 351.00
Support 3 (S3) 345.95
Resistance 1 (R1) 373.85
Resistance 2 (R2) 378.90
Resistance 3 (R3) 387.80
Interpretation:
If price retraces, the pivot ~ ₹365 may act as first “balancing” zone.
Key supports below are between ₹346–351 — failure below could weaken short-term bullishness.
Upside resistances from today’s pivot are ₹374 → ₹379 → ₹388 — crossing these may signal stronger bullish momentum for the day.
✅ My Trading-day “Game Plan” (Hypothetical)
If I were trading INDIACEM today (intraday or short-term):
Could consider a long entry if the stock sustains above ₹402–405, with stop-loss near ₹377–380 (just below R2/R3).
If price slips back and tests pivot ~ ₹365 or support ~ ₹350–355, that could be a buy-on-dip zone.
On the upside, a move beyond ₹388 could open up short-term upside toward ₹395–405 (given stock’s recent volatility).
Pubblicazioni correlate
Declinazione di responsabilità
Le informazioni e le pubblicazioni non sono intese come, e non costituiscono, consulenza o raccomandazioni finanziarie, di investimento, di trading o di altro tipo fornite o approvate da TradingView. Per ulteriori informazioni, consultare i Termini di utilizzo.