📌 INDUS TOWERS LTD – Daily Chart Setup
🔹 *Tight Base After Breakdown – Bounce or Breakdown?*
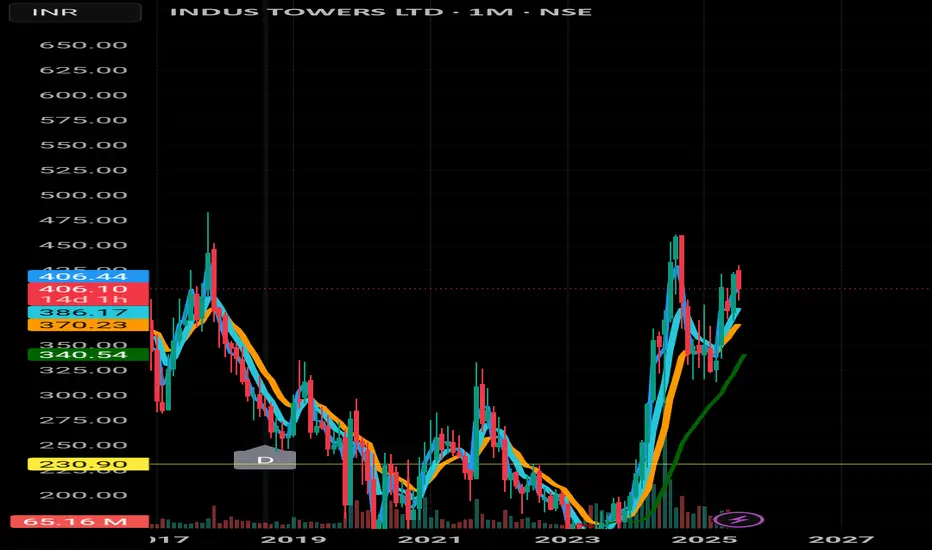
📅 Daily Chart Highlights:
• CMP: ₹407.50
• Price stabilizing after sharp fall from ₹426+
• Currently stuck between ₹400 (support zone) and ₹408.50–410 (resistance)
• Volume tapering off — indicating a possible squeeze before a move
• Price trying to form higher lows, but not convincingly breaking out
🎯 Action Plan:
• 📈 Entry: Fresh long only above ₹410.50 with closing strength
• 🛑 Stop Loss: ₹398 (closing basis)
• 🎯 Target 1: ₹418
• 🎯 Target 2: ₹426
• ⚠️ Avoid entry if price stays below ₹404. Breakdown risk remains
• ⛔ Exit below ₹398 — indicates failed structure and downside risk
📉 If price closes below ₹398, weakness could drag price toward ₹385–380 zone.
📢 **Disclaimer:** This is a technical chart analysis, not a buy/sell recommendation. Do your own research or consult your advisor before acting on it.
🔹 *Tight Base After Breakdown – Bounce or Breakdown?*
📅 Daily Chart Highlights:
• CMP: ₹407.50
• Price stabilizing after sharp fall from ₹426+
• Currently stuck between ₹400 (support zone) and ₹408.50–410 (resistance)
• Volume tapering off — indicating a possible squeeze before a move
• Price trying to form higher lows, but not convincingly breaking out
🎯 Action Plan:
• 📈 Entry: Fresh long only above ₹410.50 with closing strength
• 🛑 Stop Loss: ₹398 (closing basis)
• 🎯 Target 1: ₹418
• 🎯 Target 2: ₹426
• ⚠️ Avoid entry if price stays below ₹404. Breakdown risk remains
• ⛔ Exit below ₹398 — indicates failed structure and downside risk
📉 If price closes below ₹398, weakness could drag price toward ₹385–380 zone.
📢 **Disclaimer:** This is a technical chart analysis, not a buy/sell recommendation. Do your own research or consult your advisor before acting on it.
Started like everyone else — chasing trends, ignoring risk.
Learned the hard way that survival beats prediction.
Now I share structured equity views and hedged options plays using Renko and macro context — built for consistency, not dopamine.
Learned the hard way that survival beats prediction.
Now I share structured equity views and hedged options plays using Renko and macro context — built for consistency, not dopamine.
Declinazione di responsabilità
Le informazioni ed i contenuti pubblicati non costituiscono in alcun modo una sollecitazione ad investire o ad operare nei mercati finanziari. Non sono inoltre fornite o supportate da TradingView. Maggiori dettagli nelle Condizioni d'uso.