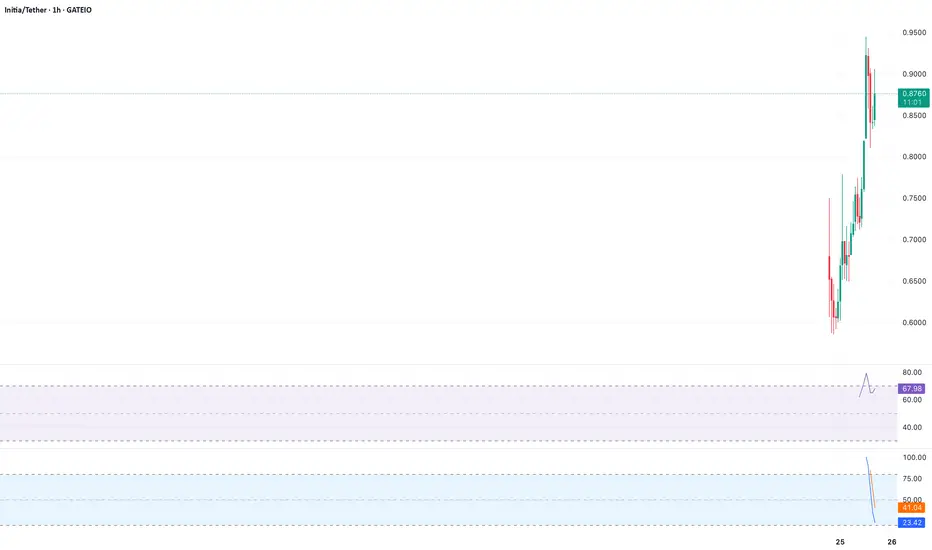
Analysis:  INIT is testing the $0.85 resistance level after a strong bounce from the $0.75 support, forming a bullish ascending triangle on the 4H chart. The RSI is at 60, indicating room for upward momentum, and the MACD shows a bullish crossover. A break above $0.87 could target $0.95, with strong volume supporting the move. Set a stop-loss below $0.80 to manage risk.
Key Levels: Resistance: $0.87, $0.95 | Support: $0.80, $0.75
Indicators: RSI (60), MACD (Bullish), Volume (Increasing)
Key Levels: Resistance: $0.87, $0.95 | Support: $0.80, $0.75
Indicators: RSI (60), MACD (Bullish), Volume (Increasing)
Declinazione di responsabilità
Le informazioni ed i contenuti pubblicati non costituiscono in alcun modo una sollecitazione ad investire o ad operare nei mercati finanziari. Non sono inoltre fornite o supportate da TradingView. Maggiori dettagli nelle Condizioni d'uso.
Declinazione di responsabilità
Le informazioni ed i contenuti pubblicati non costituiscono in alcun modo una sollecitazione ad investire o ad operare nei mercati finanziari. Non sono inoltre fornite o supportate da TradingView. Maggiori dettagli nelle Condizioni d'uso.