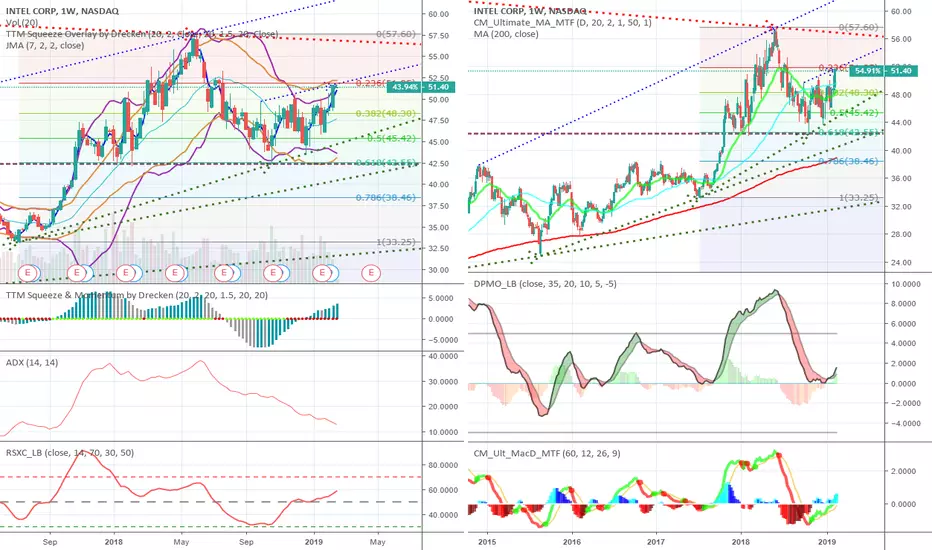
This is just a prime 1W chart. On the left, you'll see ADX in the sweet spot (sub-20), RSX above midline but not overbought and accelerating upward, TTM squeeze is on and looks primed for a massive breakout if it can clear resistance around 52. On the right, the MAs all look bullish (Green = EMA20, Turquoise = SMA50, Red = SMA200), and, perhaps most importantly for long-term signals, we've got a strong PMO crossover that started in January.
My opinion: If INTC breaks out above the downward upper resistance trendline (red), there's not much stopping it from running up to 75 and testing ATH from 2000.
My opinion: If INTC breaks out above the downward upper resistance trendline (red), there's not much stopping it from running up to 75 and testing ATH from 2000.
Nota
Here we are . . . up 14% since my post. Now, INTC has broken the downward resistance trend line. Watch for this to print 60.00 next week.
Declinazione di responsabilità
Le informazioni ed i contenuti pubblicati non costituiscono in alcun modo una sollecitazione ad investire o ad operare nei mercati finanziari. Non sono inoltre fornite o supportate da TradingView. Maggiori dettagli nelle Condizioni d'uso.
Declinazione di responsabilità
Le informazioni ed i contenuti pubblicati non costituiscono in alcun modo una sollecitazione ad investire o ad operare nei mercati finanziari. Non sono inoltre fornite o supportate da TradingView. Maggiori dettagli nelle Condizioni d'uso.