Indian Renewable Energy Development Agency Ltd – Volume Surge Near Breakout Zone
 IREDA
IREDA
📈 Pattern & Setup:
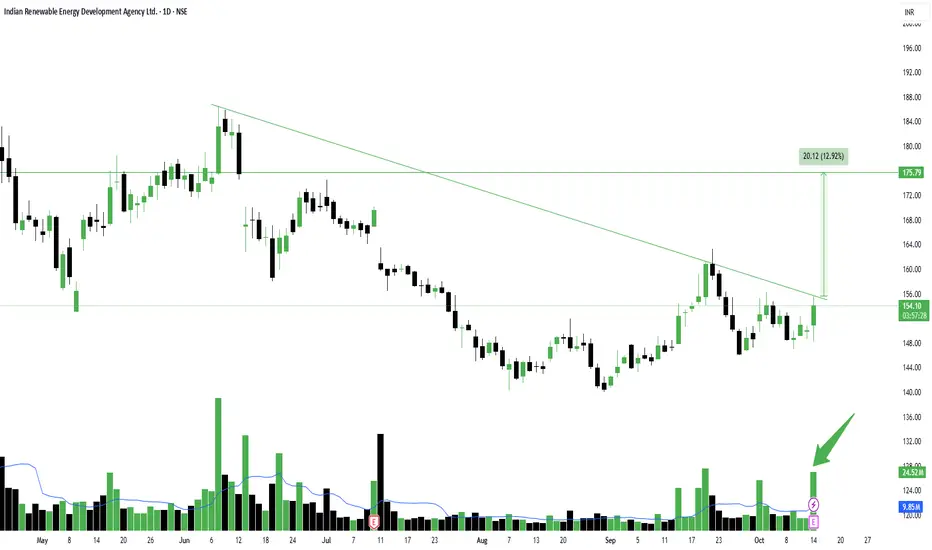
IREDA is showing signs of strength after weeks of consolidation. The stock has been moving inside a descending channel, and now it’s testing the upper trendline with a strong green candle backed by a clear volume spike — a sign that buyers are returning aggressively.
The repeated shakeouts near 145–148 have absorbed selling pressure, while today’s move above 152–153 levels indicates growing momentum. A breakout above 156–158 with follow-through could lead to a sharp upside toward 175+.
📝 Trade Plan:
✍Entry: Above 158 (breakout confirmation)
🚩Stop-Loss: 148 (below the recent low)
🎯Targets:
Target 1 → 168
Target 2 → 176 (13% potential move)
💡 Pyramiding Strategy:
1. Enter with 60% position above 158
2. Add 40% more once it sustains above 162 with strong volume
3. Trail stop-loss to 152 after price crosses 166
🧠 Logic Behind Selecting this Trade:
The price action indicates a potential trend reversal setup forming after multiple shakeouts and low-volume pullbacks. The surge in volume seen today is the first real confirmation of accumulation. If the breakout follows through, the structure could transform into a broader trend continuation pattern.
Keep Learning. Keep Earning.
Let’s grow together 📚🎯
🔴Disclaimer:
This analysis is for educational purposes only. Not a buy/sell recommendation. Please do your own research or consult your financial advisor before trading.
📈 Pattern & Setup:
IREDA is showing signs of strength after weeks of consolidation. The stock has been moving inside a descending channel, and now it’s testing the upper trendline with a strong green candle backed by a clear volume spike — a sign that buyers are returning aggressively.
The repeated shakeouts near 145–148 have absorbed selling pressure, while today’s move above 152–153 levels indicates growing momentum. A breakout above 156–158 with follow-through could lead to a sharp upside toward 175+.
📝 Trade Plan:
✍Entry: Above 158 (breakout confirmation)
🚩Stop-Loss: 148 (below the recent low)
🎯Targets:
Target 1 → 168
Target 2 → 176 (13% potential move)
💡 Pyramiding Strategy:
1. Enter with 60% position above 158
2. Add 40% more once it sustains above 162 with strong volume
3. Trail stop-loss to 152 after price crosses 166
🧠 Logic Behind Selecting this Trade:
The price action indicates a potential trend reversal setup forming after multiple shakeouts and low-volume pullbacks. The surge in volume seen today is the first real confirmation of accumulation. If the breakout follows through, the structure could transform into a broader trend continuation pattern.
Keep Learning. Keep Earning.
Let’s grow together 📚🎯
🔴Disclaimer:
This analysis is for educational purposes only. Not a buy/sell recommendation. Please do your own research or consult your financial advisor before trading.
TrendX INC
Declinazione di responsabilità
Le informazioni ed i contenuti pubblicati non costituiscono in alcun modo una sollecitazione ad investire o ad operare nei mercati finanziari. Non sono inoltre fornite o supportate da TradingView. Maggiori dettagli nelle Condizioni d'uso.
TrendX INC
Declinazione di responsabilità
Le informazioni ed i contenuti pubblicati non costituiscono in alcun modo una sollecitazione ad investire o ad operare nei mercati finanziari. Non sono inoltre fornite o supportate da TradingView. Maggiori dettagli nelle Condizioni d'uso.