The technical structure for this asset is exhibiting compelling signs that a significant low may be forming, suggesting the prolonged downtrend could be exhausting and a reversal phase may be underway. The convergence of key Fibonacci levels and emerging bullish signals creates a narrative worthy of close attention.
1. The Macro View: A Likely Bottom Formation
The assessment that the asset has "most likely bottomed" is based on key technical behaviors. This typically involves a period of price consolidation at lower levels, a slowing of downward momentum (as indicated by potential bullish divergences on oscillators like the RSI or MACD), and a clear rejection of further lows. This price action suggests that selling pressure is drying up and a new equilibrium is being established, providing a foundation for a potential new upward cycle.
2. The Fibonacci Framework: A Roadmap for the Reversal
Fibonacci retracement levels, applied to the most recent significant downtrend, provide a mathematical roadmap for identifying potential support, entry zones, and profit targets.
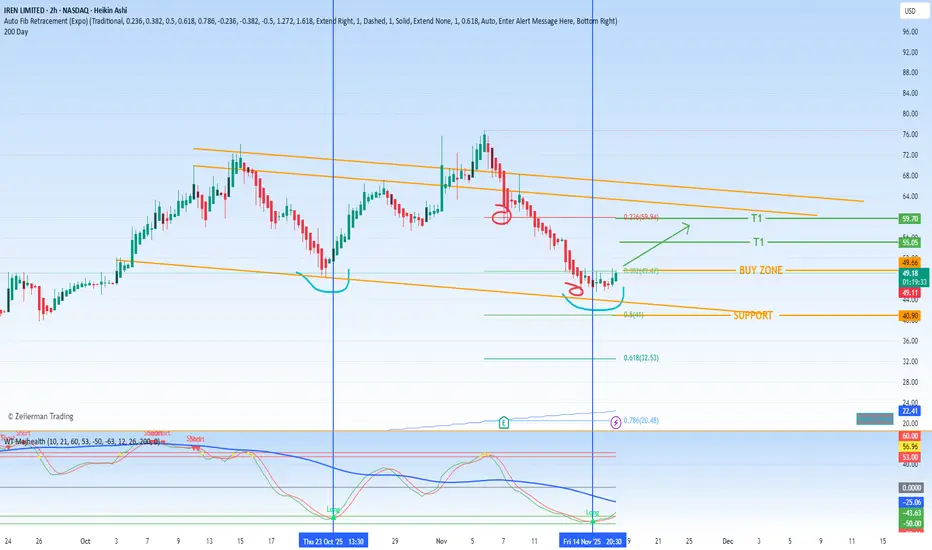
Primary Support (The 0.5 Fibonacci Level - $41): This level at $41 has acted as a critical foundation. The successful defense of this 0.50 retracement level is a strong technical sign. It represents a key psychological midpoint where buyers have historically stepped in with force, preventing further decline and solidifying this zone as the primary support floor for the new bullish thesis. A break below this level would seriously challenge the bottoming narrative.
Buy Zone (The 0.382 Fibonacci Level - $49.47): The $49.47 level is identified as a strategic accumulation zone. In a recovering market, prices often pull back to retest former resistance levels, which then turn into new support. A successful retest of the 0.382 level at $49.47, where the price touches this area and bounces, would offer a high-confidence entry point with a well-defined risk level just below the primary $41 support.
3. Profit-Taking Strategy and Emerging Signals
Take-Profit Targets: The initial recovery move has two clear technical objectives.
Initial Target: $55. This represents the first significant resistance zone where some profit-taking can be expected.
Extended Target: $59. A break above $55 opens the path to this more substantial target, which likely aligns with a previous swing high or a key Fibonacci extension level.
Potential Buy Signal (Blue Vertical Lines): Your observation of the "blue vertical lines" indicating a potential buy signal is crucial. This typically refers to a specific trigger from a momentum oscillator or a proprietary indicator. This signal adds a layer of confirmation, suggesting that not only is the price at a supportive level, but the underlying momentum is also shifting from bearish to bullish. This alignment between price (Fibonacci level) and momentum (buy signal) significantly strengthens the case for a sustainable upward move.
Synthesis and Strategic Outlook
The technical picture suggests the asset is in the early stages of a potential trend reversal.
The Bullish Narrative: The bottom appears to be in at the $41 (0.50 Fib) support. The strategy is to look for entry opportunities, ideally on a pullback towards the $49.47 (0.382 Fib) buy zone, especially if it coincides with a confirmed buy signal from your indicator (the blue vertical lines). The subsequent targets are $55 and $59.
Risk Management: The entire bullish thesis depends on the asset holding above the $41 support. A decisive break below this level would invalidate the bottoming premise and call for a re-evaluation.
In summary, patience is key. The setup is promising, but waiting for the price to interact with the defined buy zone and for confirming signals to align will provide a much higher-probability entry for the anticipated move toward the $55 and $59 targets.
1. The Macro View: A Likely Bottom Formation
The assessment that the asset has "most likely bottomed" is based on key technical behaviors. This typically involves a period of price consolidation at lower levels, a slowing of downward momentum (as indicated by potential bullish divergences on oscillators like the RSI or MACD), and a clear rejection of further lows. This price action suggests that selling pressure is drying up and a new equilibrium is being established, providing a foundation for a potential new upward cycle.
2. The Fibonacci Framework: A Roadmap for the Reversal
Fibonacci retracement levels, applied to the most recent significant downtrend, provide a mathematical roadmap for identifying potential support, entry zones, and profit targets.
Primary Support (The 0.5 Fibonacci Level - $41): This level at $41 has acted as a critical foundation. The successful defense of this 0.50 retracement level is a strong technical sign. It represents a key psychological midpoint where buyers have historically stepped in with force, preventing further decline and solidifying this zone as the primary support floor for the new bullish thesis. A break below this level would seriously challenge the bottoming narrative.
Buy Zone (The 0.382 Fibonacci Level - $49.47): The $49.47 level is identified as a strategic accumulation zone. In a recovering market, prices often pull back to retest former resistance levels, which then turn into new support. A successful retest of the 0.382 level at $49.47, where the price touches this area and bounces, would offer a high-confidence entry point with a well-defined risk level just below the primary $41 support.
3. Profit-Taking Strategy and Emerging Signals
Take-Profit Targets: The initial recovery move has two clear technical objectives.
Initial Target: $55. This represents the first significant resistance zone where some profit-taking can be expected.
Extended Target: $59. A break above $55 opens the path to this more substantial target, which likely aligns with a previous swing high or a key Fibonacci extension level.
Potential Buy Signal (Blue Vertical Lines): Your observation of the "blue vertical lines" indicating a potential buy signal is crucial. This typically refers to a specific trigger from a momentum oscillator or a proprietary indicator. This signal adds a layer of confirmation, suggesting that not only is the price at a supportive level, but the underlying momentum is also shifting from bearish to bullish. This alignment between price (Fibonacci level) and momentum (buy signal) significantly strengthens the case for a sustainable upward move.
Synthesis and Strategic Outlook
The technical picture suggests the asset is in the early stages of a potential trend reversal.
The Bullish Narrative: The bottom appears to be in at the $41 (0.50 Fib) support. The strategy is to look for entry opportunities, ideally on a pullback towards the $49.47 (0.382 Fib) buy zone, especially if it coincides with a confirmed buy signal from your indicator (the blue vertical lines). The subsequent targets are $55 and $59.
Risk Management: The entire bullish thesis depends on the asset holding above the $41 support. A decisive break below this level would invalidate the bottoming premise and call for a re-evaluation.
In summary, patience is key. The setup is promising, but waiting for the price to interact with the defined buy zone and for confirming signals to align will provide a much higher-probability entry for the anticipated move toward the $55 and $59 targets.
Trade attivo
A NICE BOUNCE FROM SUPPORT Declinazione di responsabilità
Le informazioni e le pubblicazioni non sono intese come, e non costituiscono, consulenza o raccomandazioni finanziarie, di investimento, di trading o di altro tipo fornite o approvate da TradingView. Per ulteriori informazioni, consultare i Termini di utilizzo.
Declinazione di responsabilità
Le informazioni e le pubblicazioni non sono intese come, e non costituiscono, consulenza o raccomandazioni finanziarie, di investimento, di trading o di altro tipo fornite o approvate da TradingView. Per ulteriori informazioni, consultare i Termini di utilizzo.