As per the Latest SEBI Mandate, this isn't a Trading/Investment RECOMMENDATION nor for Educational Purposes; it is just for Informational purposes only. The chart data used is 3 Months old, as Showing Live Chart Data is not allowed according to the New SEBI Mandate.
Disclaimer: "I am not a SEBI REGISTERED RESEARCH ANALYST AND INVESTMENT ADVISER."
This analysis is intended solely for informational purposes and should not be interpreted as financial advice. It is advisable to consult a qualified financial advisor or conduct thorough research before making investment decisions.
Price Action:
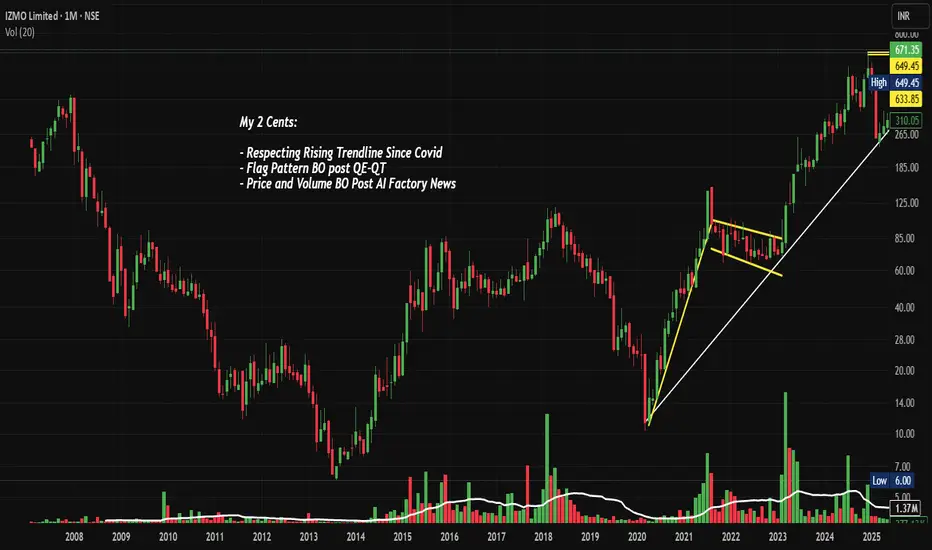
- Current Price: ₹671.35 (as of Aug 31, 2025)
- 52-Week Range: ₹230.00 - ₹738.40
- Stock has demonstrated exceptional momentum with 11,000%+ returns since COVID lows
- Currently trading near all-time highs with strong volume confirmation
Volume Spread Analysis:
- Volume spike evident during recent breakout phases
- 13.5M volume this month, showing active institutional participation
- Volume pattern confirms genuine breakout above resistance zones
- Higher volume on up days indicates accumulation by smart money
Key Technical Levels:
Support Levels:
- Primary Support: ₹633.85 (previous resistance turned support)
- Secondary Support: ₹580-590 zone (trend line confluence)
- Critical Support: ₹520-540 (major demand zone)
Resistance Levels:
- Immediate Resistance: ₹738.40 (all-time high)
- Secondary Resistance: ₹800-850 (psychological levels)
- Extended Target: ₹950-1000 (measured move projection)
Base Formation:
- Multi-year base formation from 2020-2022 (₹20-80 range)
- Clean breakout above ₹100 marked the beginning of the current uptrend
- Stage 2 markup phase with consistently higher highs and higher lows
Technical Patterns Identified:
- Cup and Handle pattern completed on a monthly timeframe
- Ascending triangle breakout above ₹600
- Bull flag consolidation pattern near current levels
- Rising wedge formation within broader uptrend (caution signal)
Sectoral and Fundamental Backdrop:
Company Overview:
-
- Founded by Dinanath Soni and Sanjay Vedprakash Soni in 1995, headquartered in Bangalore
Recent Catalysts:
- The company recently launched its Automotive AI Factory, a breakthrough innovation hub to accelerate AI adoption across the automotive industry
- The AI Factory can deliver enterprise-grade AI capabilities at 70-80% lower cost than Western markets
- The hub will deliver customized AI models that optimize pricing and operations while enhancing customer engagement
Financial Metrics:
- Market Cap: ₹1,000 Crores (up 64.5% in 1 year)
- Revenue: ₹234 Crores, Profit: ₹49 Crores
- Trading at 2.78 times book value and 19.6x P/E
- Promoter holding: 34.95%
Sectoral Trends:
- The automotive industry is increasingly adopting AI-driven solutions
- Digital transformation in automotive retail is accelerating post-COVID
- Growing demand for interactive marketing solutions globally
- India emerging as a cost-effective hub for AI and tech services
Key Risks:
- Recent Q1FY26 results showed a -5.52% QoQ revenue decline and -12.9% QoQ net profit decrease
- Concentration risk in the automotive sector
- Currency fluctuation risk due to international operations
Bullish Factors:
- Revolutionary AI Factory launch provides new growth avenue
- Strong technical breakout with volume confirmation
- Global leadership position in niche automotive marketing space
- Cost advantage in AI solutions delivery
- Multi-year base breakout suggesting sustainable uptrend
Risk Factors:
- Recent quarterly performance decline
- Elevated valuation levels
- Potential for profit-taking near all-time highs
- Sector-specific risks and economic sensitivity
Full Coverage on my Newsletter this Week
Keep in the Watchlist and DOYR.
NO RECO. For Buy/Sell.
📌Thank you for exploring my idea! I hope you found it valuable.
🙏FOLLOW for more
👍BOOST if you found it useful.
✍️COMMENT below with your views.
Meanwhile, check out my other stock ideas on the right side until this trade is activated. I would love your feedback.
As per the Latest SEBI Mandate, this isn't a Trading/Investment RECOMMENDATION nor for Educational Purposes, it is just for Informational purposes only. The chart data used is 3 Months old, as Showing Live Chart Data is not allowed according to the New SEBI Mandate.
Disclaimer: "I am not a SEBI REGISTERED RESEARCH ANALYST AND INVESTMENT ADVISER."
This analysis is intended solely for informational purposes and should not be interpreted as financial advice. It is advisable to consult a qualified financial advisor or conduct thorough research before making investment decisions.
Trade attivo
Not a Buy Sell RECO. But if you have read my thesis, the stock went almost double from that level. Kindly Save your Profits by trailing SL or Exit Partial Qty at least.Pubblicazioni correlate
Declinazione di responsabilità
Le informazioni e le pubblicazioni non sono intese come, e non costituiscono, consulenza o raccomandazioni finanziarie, di investimento, di trading o di altro tipo fornite o approvate da TradingView. Per ulteriori informazioni, consultare i Termini di utilizzo.
Pubblicazioni correlate
Declinazione di responsabilità
Le informazioni e le pubblicazioni non sono intese come, e non costituiscono, consulenza o raccomandazioni finanziarie, di investimento, di trading o di altro tipo fornite o approvate da TradingView. Per ulteriori informazioni, consultare i Termini di utilizzo.