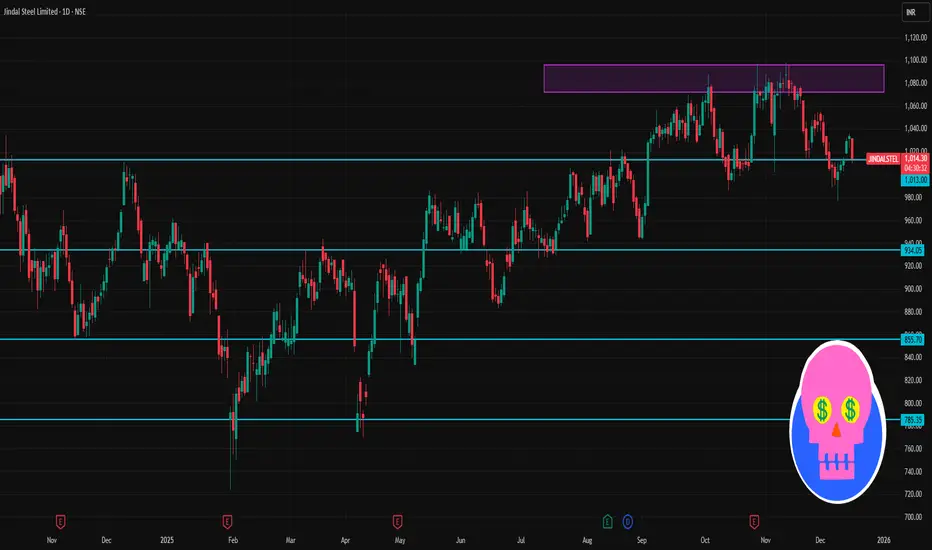
📊 Daily Pivot & Key Levels
Pivot Point (Reference): ~₹1,010–₹1,010.27
(This is the central level where direction bias flips intraday.)
🔼 Resistance Levels
R1: ~₹1,017.9 – ₹1,018 📈
R2: ~₹1,022.9 – ₹1,041 📈
R3: ~₹1,030.6 – ₹1,049.9 📈
(Breaking and holding above these can signal bullish strength.)
🔽 Support Levels
S1: ~₹1,005.2 – ₹1,006.2 📉
S2: ~₹997.5 – ₹1,012 📉
S3: ~₹992.5 – ₹1,006 📉
(These act as downside cushions — watch for bounces or breakdowns.)
📈 Short‑Term Bias & Indicators
Moving Averages: Near current price, shorter and medium SMAs/EMAs are tight — indicating potential range trading unless breakout occurs.
RSI: Around neutral (~49), not strongly overbought/oversold.
📊 How Traders Use These
Bullish Scenario: Price sustaining above Pivot → target R1 ➜ R2 ➜ R3.
Bearish Scenario: Price breaking below Pivot → test S1 ➜ S2 ➜ S3.
Range Trades: Buy near supports with stop just below; sell near resistance with stop just above.
Pubblicazioni correlate
Declinazione di responsabilità
Le informazioni e le pubblicazioni non sono intese come, e non costituiscono, consulenza o raccomandazioni finanziarie, di investimento, di trading o di altro tipo fornite o approvate da TradingView. Per ulteriori informazioni, consultare i Termini di utilizzo.