1. Major Trend
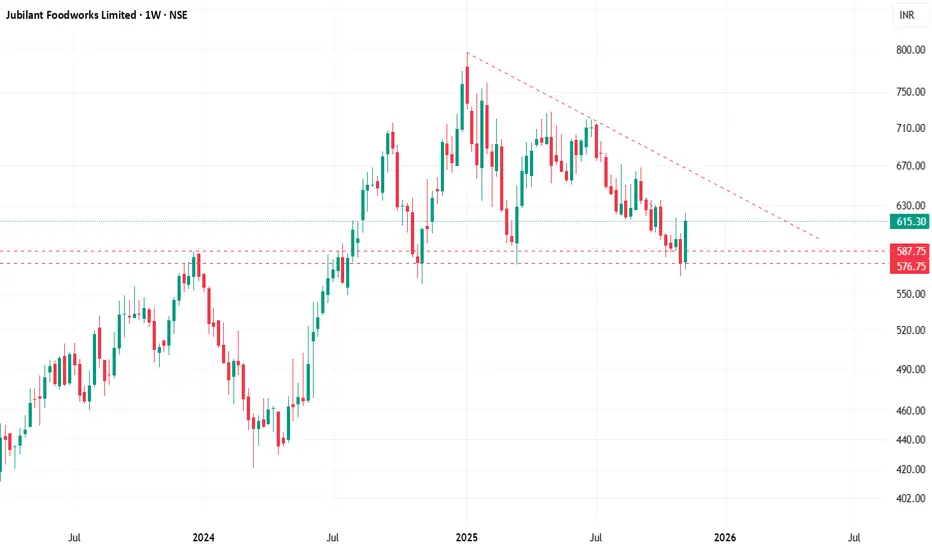
The stock has been in a broader downtrend since its peak near ₹780–₹800, forming a clear descending trendline with lower highs.
Recent candles indicate loss of downside momentum, suggesting a possible base formation near the ₹575–₹585 zone.
2. Key Levels
🔹 Support Zone (Demand Zone) – ₹575 to ₹588
The chart highlights two red dotted lines around ₹587.75 and ₹576.75.
This zone has acted as multi-month support where buyers consistently defend.
Price recently rebounded strongly from this zone, forming a bullish weekly candle.
🔹 Immediate Resistance – ₹625–₹630
Price is currently at ₹615, approaching a minor resistance around ₹625/630, which also aligns with horizontal congestion from past candles.
🔹 Major Resistance – Descending Trendline (~₹650–₹670)
The stock must break out above ₹650–₹670 to signal a trend reversal.
This is the key technical barrier stopping the bulls since 2024.
3. Price Action Analysis
A sharp bounce (+6.7% weekly) from major support suggests:
Short-term accumulation
Buyers stepping in aggressively
Weekly candle body shows strong recovery, rejecting lower levels decisively.
4. Indicators / Structural Outlook
Based on visible structure since actual indicators not shown
Multiple touches on the descending trendline indicate:
Supply exhaustion nearing
A possible breakout attempt in coming weeks if volumes support
Supports are holding well → High probability of range-bound movement between:
₹575–₹630 (base)
₹630–₹670 (breakout zone)
5. Trading Outlook
📌 Bullish Scenario
Sustained close above ₹630 → First positive sign
Break and close above ₹670 trendline → Trend reversal confirmation
Targets: ₹720 → ₹760
📌 Bearish Scenario
Breakdown below ₹575 (weekly close)
Opens downside toward ₹545 → ₹520
📌 Neutral / Range-Bound Bias
Until price breaks out of the trendline, expect consolidation between:
₹575 (support)
₹670 (trendline resistance)
6. Summary
Stock is at a critical support zone and showing bounce strength.
Trend still bearish on higher timeframe unless it breaks ₹670.
Watch for:
₹630 → short-term resistance
₹670 → major trend shift zone
A breakout above the descending trendline could signal a medium-term trend reversal.
⚠️ Disclaimer (as requested)
This analysis is for educational and informational purposes only. It is not investment advice. Markets involve risk; consult your financial advisor before making trading or investment decisions.
Declinazione di responsabilità
Le informazioni e le pubblicazioni non sono intese come, e non costituiscono, consulenza o raccomandazioni finanziarie, di investimento, di trading o di altro tipo fornite o approvate da TradingView. Per ulteriori informazioni, consultare i Termini di utilizzo.
Declinazione di responsabilità
Le informazioni e le pubblicazioni non sono intese come, e non costituiscono, consulenza o raccomandazioni finanziarie, di investimento, di trading o di altro tipo fornite o approvate da TradingView. Per ulteriori informazioni, consultare i Termini di utilizzo.