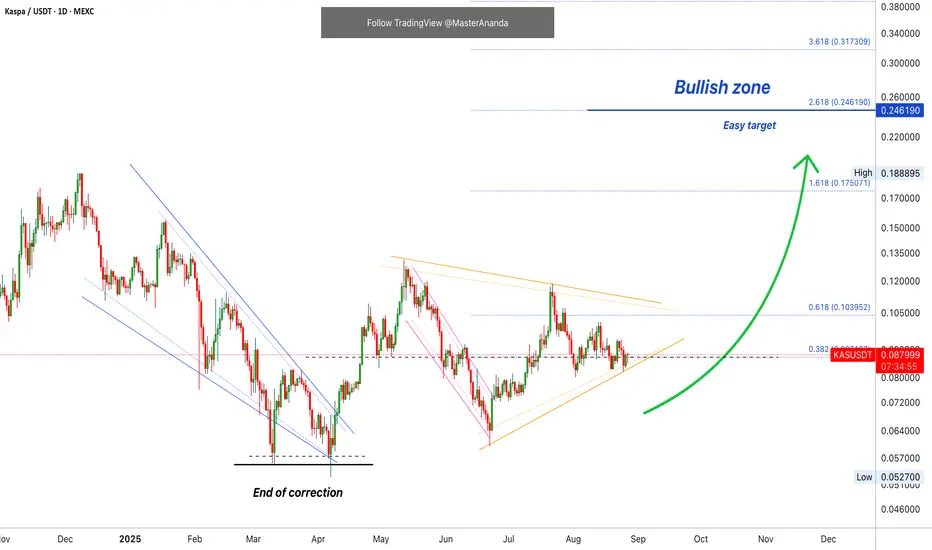
Here we have the daily (D) Kaspa (KASUSDT) chart. To me is really important to start by knowing the market direction. I can start with a process of elimination.
An uptrend is not present because we don't have higher highs and higher lows.
A downtrend is not present because we don't have lower highs and lower lows.
Which one comes next?
A correction (downtrend) just ended and the market produced a bullish move as a bounce. The jump from the 7-April low and support to the high mid-May. That's the first move and that's change.
So we know the market is no longer in a downtrend and we know it produced a bullish jump.
What happens after this bullish jump? What happens after the May peak?
The market corrects but ends in a higher low. This is classic. I know these are the same signals but they work. It is basic and simple.
The retrace from May ended in a higher low in June and this reveals a bullish bias.
So we know we are in a transition. Not a downtrend but not an uptrend either, but we know the market is bullish because the last jump ended in a higher low. The last jump is being consolidated before additional growth.
This one can take up to 10X or even more. You have to choose your own level of margin of course. Full trade-numbers below:
_____
LONG KASUSDT
ENTRY: 0.083000 - 0.089000 (STOP: 0.082000)
TARGETS: 0.103952, 0.131119, 1.58286, 1.75071, 0.202222, 0.246190
_____
Thank you for reading.
If you enjoy the content, consider hitting follow. It only takes a minute and it makes the whole difference.
Namaste.
🚨 Get the FULL (6-in-1) PREMIUM PACKAGE
lamatrades.com —Since 2017
🚨 TOP Results: ZEC +2736% · ETH +2150%, CRO +1272%, AAVE +1134%, DOGS +868%, SOL +861%, XRP +749%, BTC +580%
More 👉 t.me/masteranandatrades/6681
lamatrades.com —Since 2017
🚨 TOP Results: ZEC +2736% · ETH +2150%, CRO +1272%, AAVE +1134%, DOGS +868%, SOL +861%, XRP +749%, BTC +580%
More 👉 t.me/masteranandatrades/6681
Pubblicazioni correlate
Declinazione di responsabilità
Le informazioni e le pubblicazioni non sono intese come, e non costituiscono, consulenza o raccomandazioni finanziarie, di investimento, di trading o di altro tipo fornite o approvate da TradingView. Per ulteriori informazioni, consultare i Termini di utilizzo.