KDA/USDT 15m timeframe
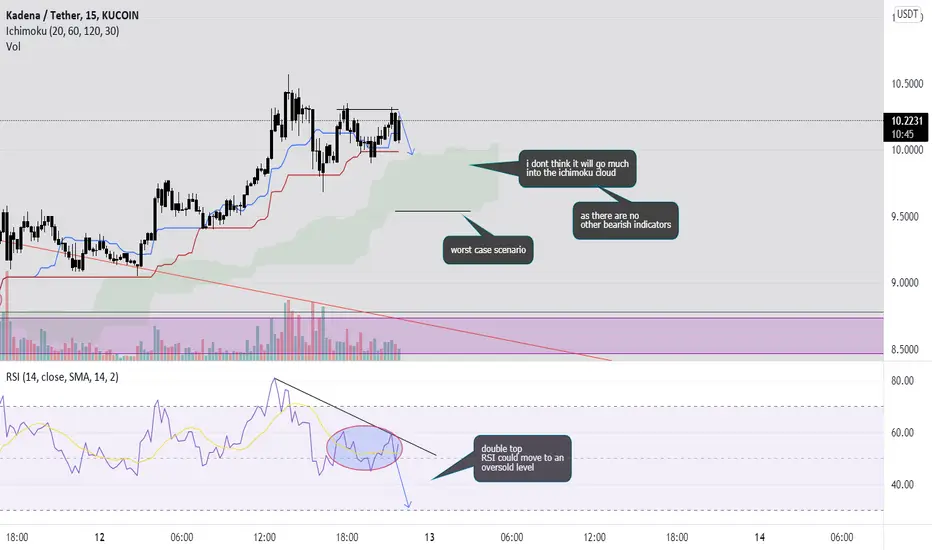
- double top on the 15m chart
- i dont think KDA will drop that much as there are no other bearish indicators
- worst case scenario is KDA drops to the bottom of the ichimoku cloud
- double top on the RSI, could move to an oversold level (below 30) which would be bullish
- i dont think KDA will drop that much as there are no other bearish indicators
- worst case scenario is KDA drops to the bottom of the ichimoku cloud
- double top on the RSI, could move to an oversold level (below 30) which would be bullish
Declinazione di responsabilità
Le informazioni e le pubblicazioni non sono intese come, e non costituiscono, consulenza o raccomandazioni finanziarie, di investimento, di trading o di altro tipo fornite o approvate da TradingView. Per ulteriori informazioni, consultare i Termini di utilizzo.
Declinazione di responsabilità
Le informazioni e le pubblicazioni non sono intese come, e non costituiscono, consulenza o raccomandazioni finanziarie, di investimento, di trading o di altro tipo fornite o approvate da TradingView. Per ulteriori informazioni, consultare i Termini di utilizzo.