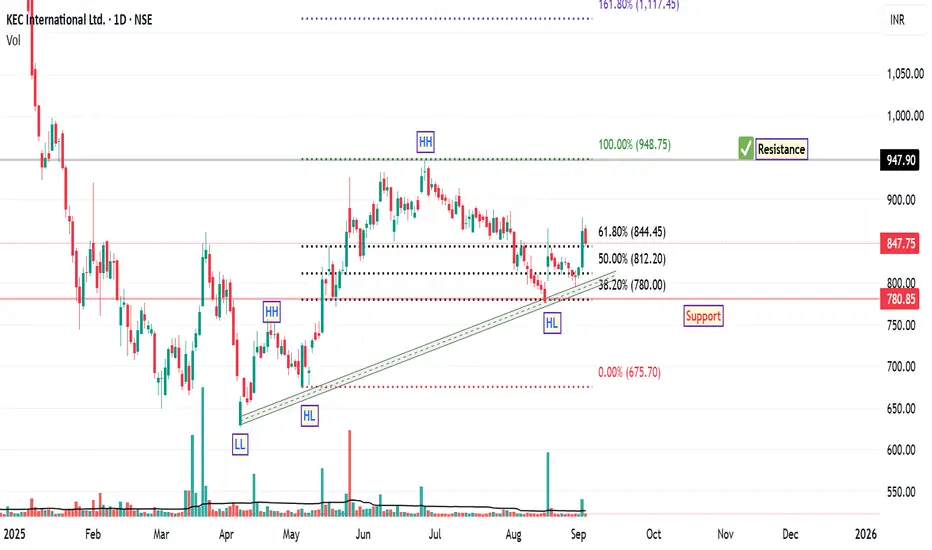
Since April 7th, the price structure of KEC International has demonstrated a notable bullish trend reversal, characterized by the formation of higher highs and higher lows along an ascending trendline. This pattern is often interpreted by technical analysts as a sign of strengthening upward momentum.
A recent Fibonacci retracement, drawn from the swing low to the swing high of the current rally, revealed a pullback to the 38.2% level—a zone commonly viewed as a potential support area within a prevailing uptrend. The stock responded positively to this level, rebounding and subsequently closing above the 61.8% retracement level, which is another key technical threshold.
Interestingly, the price has retested the 61.8% level and held firm, suggesting that this area may be acting as a support base. Additionally, the stock has managed to close above its 200-day EMA, a long-term trend indicator that many market participants use to assess broader directional bias. A sustained position above the 200 EMA is generally considered constructive from a trend-following perspective.
From a structural standpoint, based on current chart dynamics, the next potential resistance zone appears to be near ₹948, while the suggested support level is around ₹780. These levels are derived from historical price action and technical confluence zones, and may serve as reference points for monitoring future price behaviour.
Disclaimer: This analysis is intended solely for educational and informational purposes. It does not constitute investment advice or a recommendation to buy, sell, or hold any financial instrument. Market conditions are subject to change, and trading decisions should be made based on individual research, risk assessment, and consultation with a licensed financial advisor.
Declinazione di responsabilità
Le informazioni ed i contenuti pubblicati non costituiscono in alcun modo una sollecitazione ad investire o ad operare nei mercati finanziari. Non sono inoltre fornite o supportate da TradingView. Maggiori dettagli nelle Condizioni d'uso.
Declinazione di responsabilità
Le informazioni ed i contenuti pubblicati non costituiscono in alcun modo una sollecitazione ad investire o ad operare nei mercati finanziari. Non sono inoltre fornite o supportate da TradingView. Maggiori dettagli nelle Condizioni d'uso.