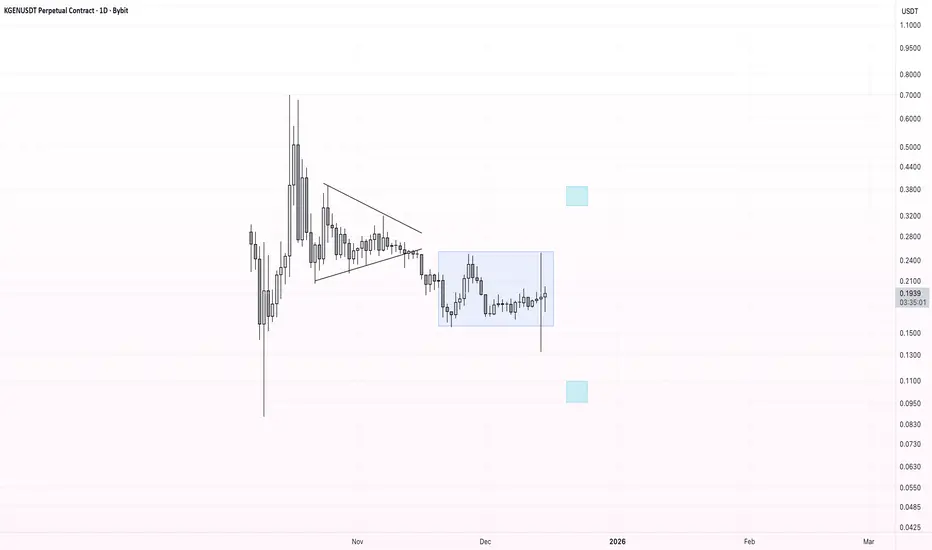
Price action is forming a classic rectangle (range), representing a consolidation phase after increased volatility. The market is compressing, building energy for the next impulsive move.
A key rule for this structure: the direction of the breakout defines the direction of the move.
Scenarios:
🔼 Bullish breakout:
– Break and acceptance above the upper range boundary
– Upside target: 🎯 $0.34
🔽 Bearish breakout:
– Break and acceptance below the lower range boundary
– Downside target: 🎯 $0.11
While price remains inside the rectangle, the market stays neutral. A confirmed breakout with volume is expected to trigger a strong directional move.
My telegram channel: t.me/blessing_cryptos
Declinazione di responsabilità
Le informazioni e le pubblicazioni non sono intese come, e non costituiscono, consulenza o raccomandazioni finanziarie, di investimento, di trading o di altro tipo fornite o approvate da TradingView. Per ulteriori informazioni, consultare i Termini di utilizzo.