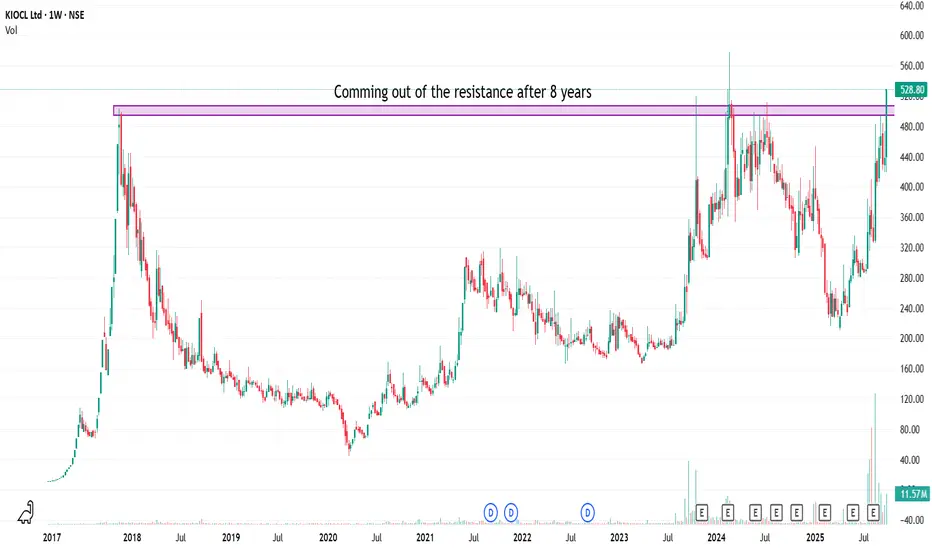
Chart is KIOCL weekly chart.
KIOCL is coming out of the long-term resistance of 8 years on closing basis with good volume .
Can be in watchlist for next few weeks. If holds above the zone of 475 to 500, can move further up.
Caution : Fundamentals are not as good as technical.
KIOCL is coming out of the long-term resistance of 8 years on closing basis with good volume .
Can be in watchlist for next few weeks. If holds above the zone of 475 to 500, can move further up.
Caution : Fundamentals are not as good as technical.
Declinazione di responsabilità
Le informazioni ed i contenuti pubblicati non costituiscono in alcun modo una sollecitazione ad investire o ad operare nei mercati finanziari. Non sono inoltre fornite o supportate da TradingView. Maggiori dettagli nelle Condizioni d'uso.
Declinazione di responsabilità
Le informazioni ed i contenuti pubblicati non costituiscono in alcun modo una sollecitazione ad investire o ad operare nei mercati finanziari. Non sono inoltre fornite o supportate da TradingView. Maggiori dettagli nelle Condizioni d'uso.