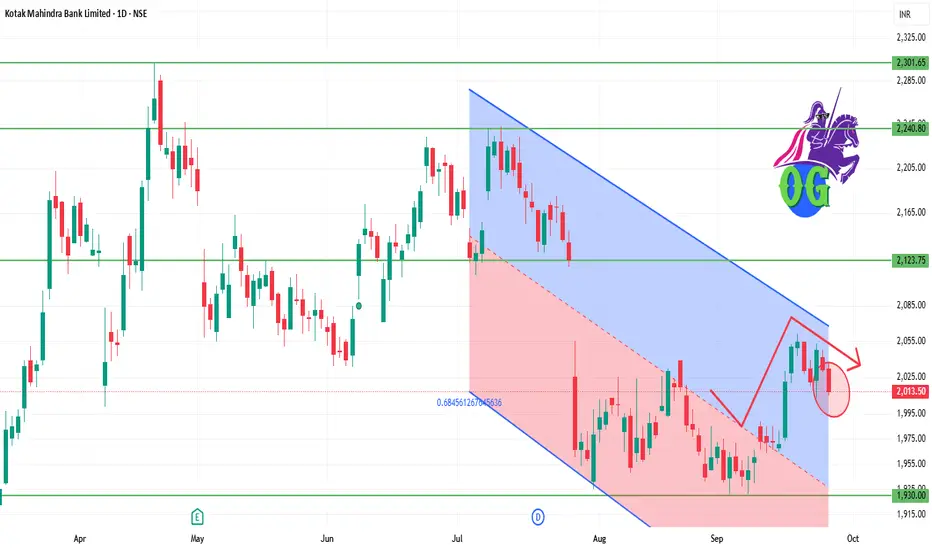
📊 Daily Snapshot
Closing Price: ₹2,013.60
Day’s Range: ₹2,012.50 – ₹2,031.30
Previous Close: ₹2,031.30
Change: Down –0.72%
52-Week Range: ₹1,679.00 – ₹2,302.00
Market Cap: ₹4.04 lakh crore
P/E Ratio: 21.09
Dividend Yield: 0.12%
EPS (TTM): ₹96.30
Beta: 0.80 (indicating lower volatility)
🔑 Key Technical Levels
Immediate Support: ₹2,000.00
Immediate Resistance: ₹2,030.00
All-Time High: ₹2,302.00
📈 Technical Indicators
RSI (14-day): 45.2 – indicating a neutral condition.
MACD: Negative, suggesting bearish momentum.
Moving Averages: Trading below the 50-day and 200-day moving averages, indicating a bearish trend.
📉 Market Sentiment
Recent Performance: Kotak Mahindra Bank's stock declined by 0.72% on September 25, 2025, underperforming the broader market.
Volume: Trading volume was significantly lower than its 50-day average, indicating decreased investor activity.
📈 Strategy (1D Timeframe)
1. Bullish Scenario
Entry: Above ₹2,030.00
Stop-Loss: ₹2,000.00
Target: ₹2,050.00 → ₹2,070.00
2. Bearish Scenario
Entry: Below ₹2,000.00
Stop-Loss: ₹2,030.00
Target: ₹1,980.00 → ₹1,960.00
Pubblicazioni correlate
Declinazione di responsabilità
Le informazioni ed i contenuti pubblicati non costituiscono in alcun modo una sollecitazione ad investire o ad operare nei mercati finanziari. Non sono inoltre fornite o supportate da TradingView. Maggiori dettagli nelle Condizioni d'uso.
Pubblicazioni correlate
Declinazione di responsabilità
Le informazioni ed i contenuti pubblicati non costituiscono in alcun modo una sollecitazione ad investire o ad operare nei mercati finanziari. Non sono inoltre fornite o supportate da TradingView. Maggiori dettagli nelle Condizioni d'uso.