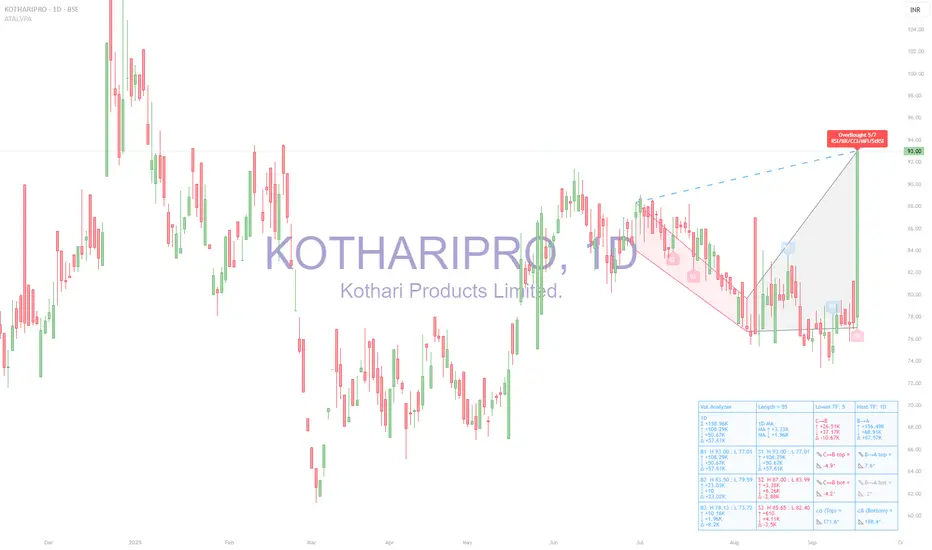
Tool used
Analysis made with ATAI Volume Pressure Analyzer (VPA), which decomposes daily flows into buy/sell volume, prints half-window deltas (C→B vs B→A), ATR-normalized wing slopes, α/β geometry at vertex B, and OverBought/OverSold spike labels confirmed by a 7-oscillator vote
1) Snapshot from HUD
◉ OB 5/7 fired on today’s +20% candle (RSI/Stoch/CCI/MFI/StRSI cluster).
◉ C→B (earlier half): Δ −14.21 → seller-tilted.
◉ B→A (recent half): Δ +72.25K → buyers in control.
◉ Angles: C→B wing both <0° (down), B→A wing both >0° (up).
◉ α=171.6°, β=188.4° → no red flags (thresholds are α>180 or β<180).
◉ Ranked zones:
- B1 High 93.0 / Low 77.0 (resistance)
- S1 Low 83.9 (support)
2) Interpretation
◉ The OB 5/7 tag warns of short-term exhaustion after an impulsive surge.
◉ Yet the right wing (B→A) shows positive deltas and slopes, meaning structure still favors buyers.
◉ No α/β stress flags, so the geometry is not “over-stretched.”
◉ The zone map is clean: B1 = resistance (93.0) and S1 = first support (83.9).
3) Scenarios
A) Base case — Pullback / Digestion
◉ Likely reaction into the S1 zone (≈84–87) after OB tag.
◉ Watch Δ(B→A): if it fades to ≤0 and wings flatten, pullback deepens.
B) Bullish continuation
◉ Requires daily acceptance above 93 with a buy-spike (TF_buy / SMA ≥1.6 or Z≥1.8).
◉ Validation = B→A Δ stays >0 and right wing >0°.
C) Bearish rotation
◉ Triggers if B→A Δ flips negative and right wing turns gray/red.
◉ Breakdown below 83.9 on a sell-spike would confirm shift.
4) Conclusion
Bias: Constructive with pullback risk.
◉ Immediate OB tag suggests a pause; however, the buyer regime in the recent half (B→A) is still active.
◉ Key invalidation = loss of 83.9 (S1) with negative Δ.
◉ Key confirmation = acceptance above 93 with buy-spike absorption.
The points above are the technical and educational details from the ATAI Volume Pressure Analyzer (VPA). Put simply, the takeaway is this:
The stock made a sharp +20% move today up to 93, and the indicator flagged an “OverBought” condition. That means buying pressure was unusually strong and the market may need to cool off with a pause or short pullback. Still, the recent volume balance shows buyers remain in control, so the broader structure is still constructive.
If price can hold above 93 with renewed strong buy-side volume, continuation to the upside is favored. But if it slips below 84 and selling pressure grows, that would mark the start of a deeper correction. In simple terms: the main trend is still positive, but after today’s surge it makes sense to expect some digestion before the next leg.
Pubblicazioni correlate
Declinazione di responsabilità
Le informazioni e le pubblicazioni non sono intese come, e non costituiscono, consulenza o raccomandazioni finanziarie, di investimento, di trading o di altro tipo fornite o approvate da TradingView. Per ulteriori informazioni, consultare i Termini di utilizzo.