📊 KALYANI STEELS LTD (KSL) – Strong Cup & Handle Breakout | Volume & RSI Confirmation | Daily Chart
📅 Chart Date: June 17, 2025
📈 CMP: ₹891.00 (+10.33%)
📍 Ticker: NSE:KSL
🔍 Technical Chart Breakdown
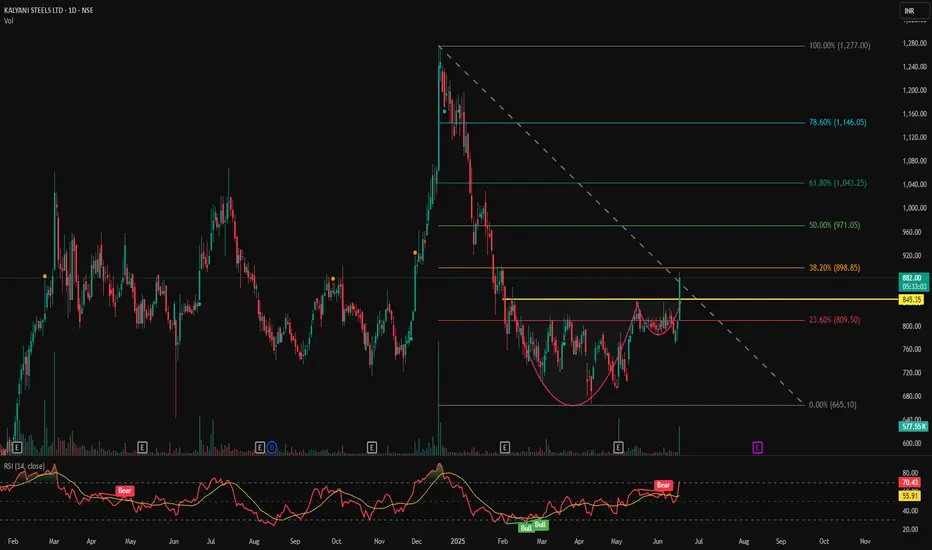
☕ Cup & Handle Pattern Breakout
KSL has decisively broken above the neckline resistance around ₹845 after forming a classic Cup & Handle pattern — a strong bullish continuation setup. This breakout has been accompanied by a solid volume spike (458.32K), which adds further confirmation.
💹 RSI Analysis
RSI is currently at 71.61, indicating strong bullish momentum.
RSI crossover confirms entry into the overbought zone, signaling strength but also requiring caution for late entries.
🕯️ Volume Action
Noticeable volume surge on the breakout candle suggests institutional participation.
Previous volume build-up near the handle zone indicates accumulation.
📍 Key Price Levels
✅ Breakout Zone: ₹845.35
🚀 Potential Upside Targets:
₹920 – Minor resistance
₹990–₹1,040 – Short to medium-term swing targets
₹1,150+ – Based on measured pattern height
🛡️ Support Zones:
₹845 – breakout retest level
₹800 – psychological support
₹765 – handle base and invalidation zone
🛠️ Trading Strategy Idea
Entry: Either breakout close above ₹845 or on retest of breakout zone
Stop Loss: Below ₹800
Targets: ₹920 → ₹1,000 → ₹1,150
Risk-Reward: >1:2 on first target with strong technical validation
📅 Chart Date: June 17, 2025
📈 CMP: ₹891.00 (+10.33%)
📍 Ticker: NSE:KSL
🔍 Technical Chart Breakdown
☕ Cup & Handle Pattern Breakout
KSL has decisively broken above the neckline resistance around ₹845 after forming a classic Cup & Handle pattern — a strong bullish continuation setup. This breakout has been accompanied by a solid volume spike (458.32K), which adds further confirmation.
💹 RSI Analysis
RSI is currently at 71.61, indicating strong bullish momentum.
RSI crossover confirms entry into the overbought zone, signaling strength but also requiring caution for late entries.
🕯️ Volume Action
Noticeable volume surge on the breakout candle suggests institutional participation.
Previous volume build-up near the handle zone indicates accumulation.
📍 Key Price Levels
✅ Breakout Zone: ₹845.35
🚀 Potential Upside Targets:
₹920 – Minor resistance
₹990–₹1,040 – Short to medium-term swing targets
₹1,150+ – Based on measured pattern height
🛡️ Support Zones:
₹845 – breakout retest level
₹800 – psychological support
₹765 – handle base and invalidation zone
🛠️ Trading Strategy Idea
Entry: Either breakout close above ₹845 or on retest of breakout zone
Stop Loss: Below ₹800
Targets: ₹920 → ₹1,000 → ₹1,150
Risk-Reward: >1:2 on first target with strong technical validation
Trade chiuso: obiettivo raggiunto
The first resistance level has been touched. If the trend is to continue, it's important to follow a trailing stop-loss strategy and patiently wait for the price to approach the second resistance level.Declinazione di responsabilità
Le informazioni ed i contenuti pubblicati non costituiscono in alcun modo una sollecitazione ad investire o ad operare nei mercati finanziari. Non sono inoltre fornite o supportate da TradingView. Maggiori dettagli nelle Condizioni d'uso.
Declinazione di responsabilità
Le informazioni ed i contenuti pubblicati non costituiscono in alcun modo una sollecitazione ad investire o ad operare nei mercati finanziari. Non sono inoltre fornite o supportate da TradingView. Maggiori dettagli nelle Condizioni d'uso.