✅ Current state & context
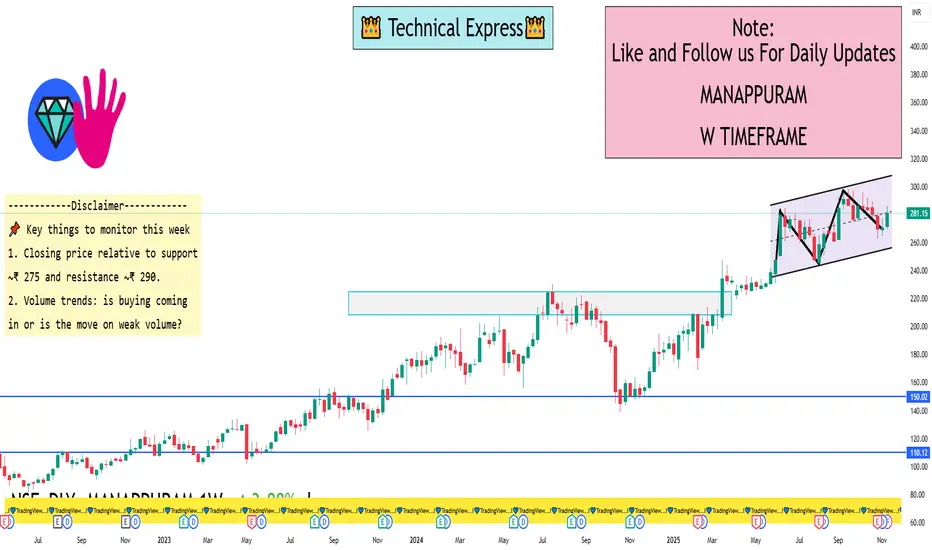
The stock is trading around ₹ 281.15 as of 14 Nov 2025.
Recent technical scan shows a “Buy” to “Strong Buy” rating in the 1-week horizon via trading-view style indicators.
From the weekly performance note: the 20-day moving average crossover appeared recently, which historically has seen a ~3.9% average gain in ~7 days (on this stock) when that signal appears.
On the fundamental side, the stock is trading at relatively high valuations (P/E ~ 50+ times) and has seen significant price appreciation in recent months.
🎯 Key support & resistance levels for the next week
From the recent price action and technical indicators:
Support zones to watch
Near the recent swing low / consolidation area around ₹ 270-275. If price pulls back, this zone could act as first buffer.
Next deeper support around ₹ 260-265, which might catch if a stronger correction shows up.
Resistance zones to watch
Immediate resistance around the recent high ~ ₹ 290-295 (given the 52-week high is ~₹ 298).
If momentum continues, a break above ~₹ 300 might open further upside, but that would require strong volume and favourable catalyst.
I built a Buy & Sell Signal Indicator with 85% accuracy.
📈 Get access via DM or
WhatsApp: wa.link/d997q0
Contact - +91 76782 40962
| Email: techncialexpress@gmail.com
| Script Coder | Trader | Investor | From India
📈 Get access via DM or
WhatsApp: wa.link/d997q0
Contact - +91 76782 40962
| Email: techncialexpress@gmail.com
| Script Coder | Trader | Investor | From India
Pubblicazioni correlate
Declinazione di responsabilità
Le informazioni e le pubblicazioni non sono intese come, e non costituiscono, consulenza o raccomandazioni finanziarie, di investimento, di trading o di altro tipo fornite o approvate da TradingView. Per ulteriori informazioni, consultare i Termini di utilizzo.