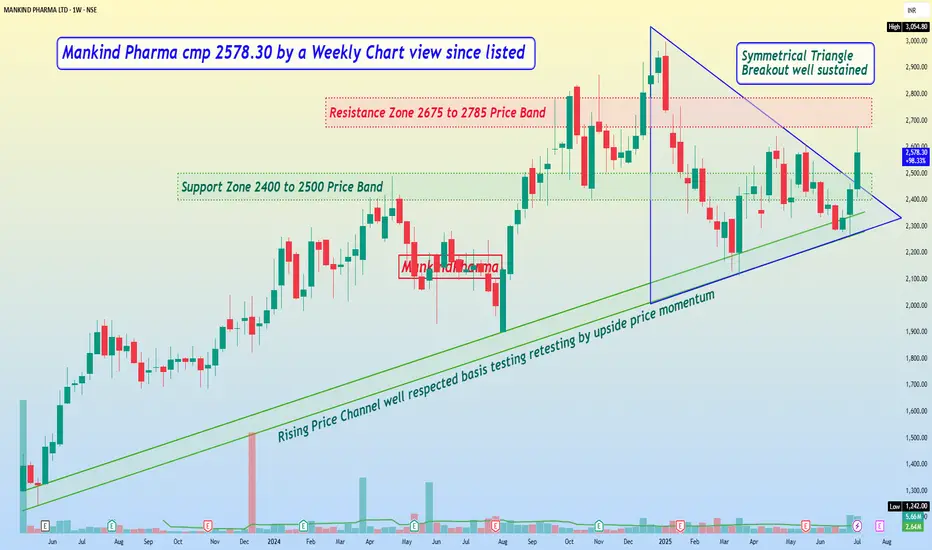
Mankind Pharma cmp 2578.30 by a Weekly Chart view since listed
- Support Zone 2400 to 2500 Price Band
- Resistance Zone 2675 to 2785 Price Band
- Symmetrical Triangle Breakout well sustained
- Back to back Bullish Rounding Bottom with Resistance Zone neckline
- Most common Technical Indicators BB, EMA, SAR, MACD, RSI turning positive
- Good Volumes increase, well above avg traded quantity by demand based buying
- Rising Price Channel well respected basis testing retesting by upside price momentum
Declinazione di responsabilità
Le informazioni ed i contenuti pubblicati non costituiscono in alcun modo una sollecitazione ad investire o ad operare nei mercati finanziari. Non sono inoltre fornite o supportate da TradingView. Maggiori dettagli nelle Condizioni d'uso.
Declinazione di responsabilità
Le informazioni ed i contenuti pubblicati non costituiscono in alcun modo una sollecitazione ad investire o ad operare nei mercati finanziari. Non sono inoltre fornite o supportate da TradingView. Maggiori dettagli nelle Condizioni d'uso.