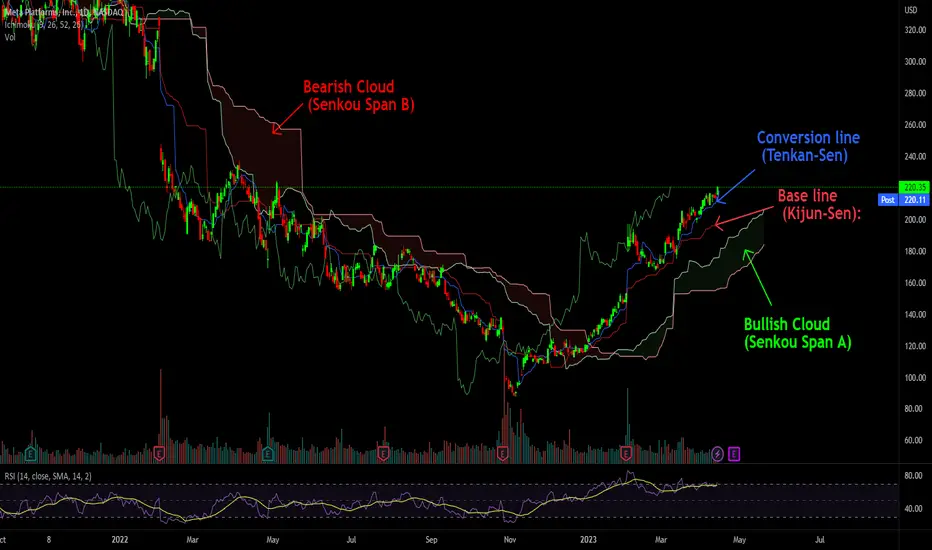
Conversion line (Tenkan-Sen): This is a short-term moving average that measures the average of the highest high and lowest low over the past nine periods. It is used to identify short-term trends in the market. (9-day)
Base line (Kijun-Sen): This is a longer-term moving average that measures the average of the highest high and lowest low over the past 26 periods. It is used to identify longer-term trends in the market. (26-day)
Lagging span (Chikou Span): This is the current closing price, plotted 26 periods behind. It is used to confirm signals given by the conversion line and base line.
Bullish Cloud (Senkou Span A): This is the area between the conversion line and the base line, shaded green on the chart. It represents support and indicates a bullish trend.
Bearish Cloud (Senkou Span B): This is the area between two longer-term moving averages, shaded red on the chart. It represents resistance and indicates a bearish trend.
Pubblicazioni correlate
Declinazione di responsabilità
Le informazioni e le pubblicazioni non sono intese come, e non costituiscono, consulenza o raccomandazioni finanziarie, di investimento, di trading o di altro tipo fornite o approvate da TradingView. Per ulteriori informazioni, consultare i Termini di utilizzo.