📊 Technical Analysis Summary:
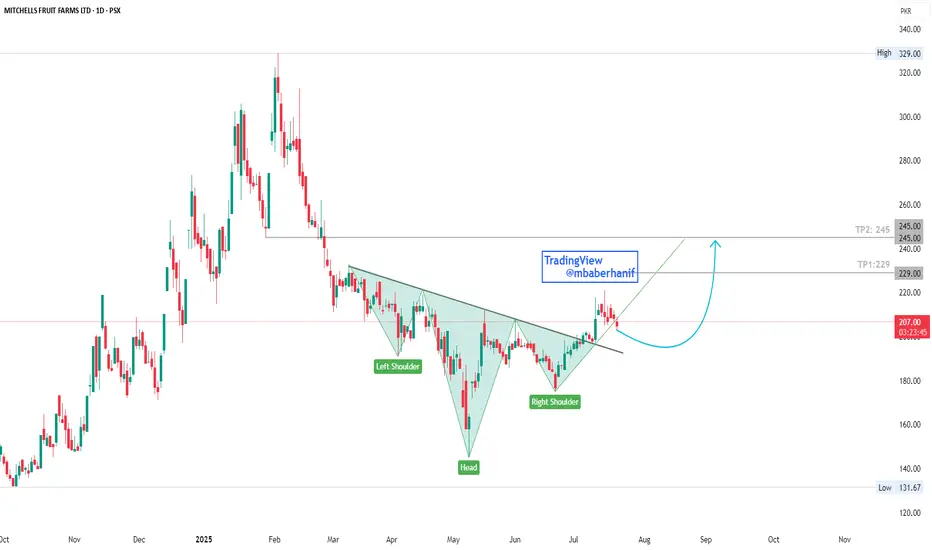
Pattern: Inverse Head and Shoulders
Left Shoulder: March 2025
Head: May 2025
Right Shoulder: June 2025
Neckline Breakout: Price has recently broken above the neckline, confirming the pattern.
Current Price: PKR 207
Support Zone: The price is currently retesting the neckline/support zone around 205–210.
Expected Move: A short-term pullback toward the neckline may occur before a bullish continuation.
Target Level: Based on the pattern projection, the target lies near PKR 229 and then 245, which also aligns with a previous resistance zone.
Trendline Support: A rising green trendline offers dynamic support, helping price structure stay bullish.
🟢 Bullish Signals:
Successful breakout from a bullish reversal pattern
Retest of neckline acting as potential support
Volume confirmation may further validate the move
🔴 Risk to Monitor:
Failure to hold above the 205 support zone might invalidate the breakout
Broader market weakness could impact the setup
Conclusion:
The chart presents a strong bullish setup with an Inverse Head and Shoulders breakout. A retest near 205 could offer a good entry with a potential upside toward 229 and then 245. Risk management is essential if price fails to hold above neckline support.
Declinazione di responsabilità
Le informazioni e le pubblicazioni non sono intese come, e non costituiscono, consulenza o raccomandazioni finanziarie, di investimento, di trading o di altro tipo fornite o approvate da TradingView. Per ulteriori informazioni, consultare i Termini di utilizzo.
Declinazione di responsabilità
Le informazioni e le pubblicazioni non sono intese come, e non costituiscono, consulenza o raccomandazioni finanziarie, di investimento, di trading o di altro tipo fornite o approvate da TradingView. Per ulteriori informazioni, consultare i Termini di utilizzo.