🔎 Macro Structure
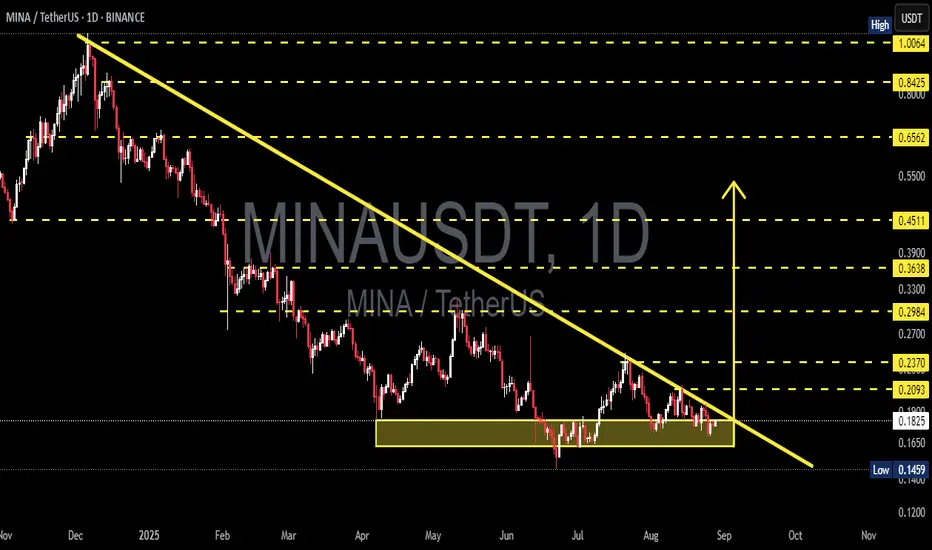
Since early 2025, MINA has been trending downward, consistently capped by a descending trendline (yellow).
Despite the ongoing bearish pressure, price has established a strong demand zone between 0.1650 – 0.1825, acting as a solid floor for nearly three months.
This structure forms a classic descending triangle:
Lower highs aligned with the descending trendline.
Flat support within the demand box.
In other words, price action is being “compressed,” signaling an imminent breakout or breakdown with high momentum.
---
🟢 Bullish Scenario
If buyers manage to break out above the descending trendline and secure a daily close above 0.2093, then:
The structure may shift into a short-term bullish reversal.
Step-by-step upside targets:
0.2370 → first resistance.
0.2984 → measured move target from the triangle height.
0.3638 – 0.4511 → potential higher resistance zones if momentum accelerates.
Such a breakout could mark the start of a trend shift from bearish to neutral-bullish.
---
🔴 Bearish Scenario
If sellers reclaim control and price breaks down below 0.1650, then:
The descending triangle breakdown confirms continuation of the broader downtrend.
Downside targets:
0.1459 → last significant low.
0.120 – 0.121 → projected target based on the triangle height.
A sustained breakdown below these levels could trigger a capitulation phase before discovering new support.
---
📊 Pattern & Market Psychology
Buyers are still defending the demand box, suggesting accumulation interest at discounted levels.
Sellers, however, remain dominant with continuous lower highs, reflecting downward pressure.
The descending triangle embodies this tug-of-war. Typically, the longer the consolidation, the stronger the breakout or breakdown that follows.
---
⚖️ Conclusion
At this stage, MINA is at a critical decision point:
Bullish case: A confirmed breakout above 0.2093 opens the door to 0.2370 and 0.2984.
Bearish case: A breakdown below 0.1650 paves the way to 0.1459 and potentially 0.120.
📌 The best approach now is patience — waiting for a clear daily close confirmation before committing to a major position, as this zone could spark MINA’s next big wave.
#MINA #MINAUSDT #CryptoAnalysis #PriceAction #DescendingTriangle #SupportResistance #BreakoutTrading #CryptoTA #ChartAnalysis
✅ Get Free Signals! Join Our Telegram Channel Here: t.me/TheCryptoNuclear
✅ Twitter: twitter.com/crypto_nuclear
✅ Join Bybit : partner.bybit.com/b/nuclearvip
✅ Benefits : Lifetime Trading Fee Discount -50%
✅ Twitter: twitter.com/crypto_nuclear
✅ Join Bybit : partner.bybit.com/b/nuclearvip
✅ Benefits : Lifetime Trading Fee Discount -50%
Declinazione di responsabilità
Le informazioni e le pubblicazioni non sono intese come, e non costituiscono, consulenza o raccomandazioni finanziarie, di investimento, di trading o di altro tipo fornite o approvate da TradingView. Per ulteriori informazioni, consultare i Termini di utilizzo.