MGL LOOK OUT FOR THESE LEVELS!!!
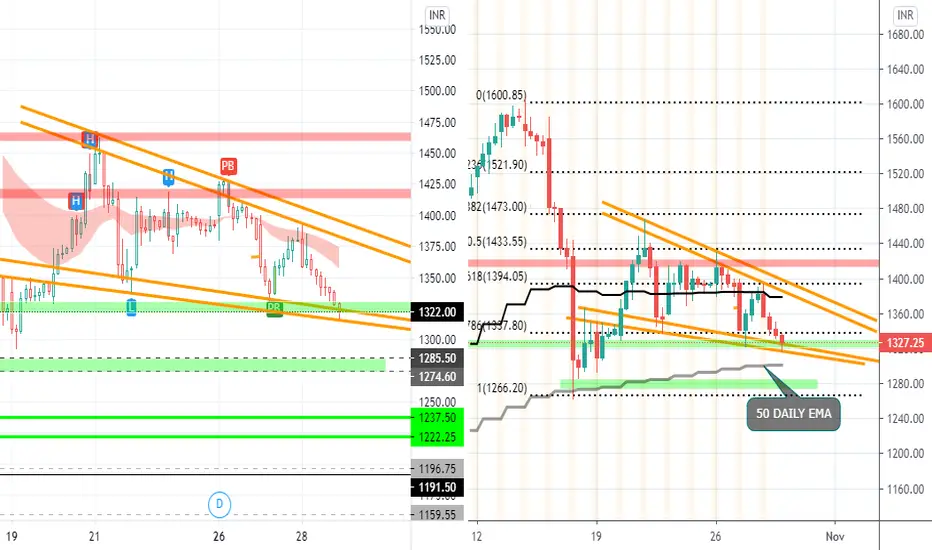
ALL THE LEVELS ARE MARKED ON CHART; FALLING WEDGE PATTERN IN HIGHER TIMEFRAME.
SELL NEAR THE RED ZONE IF REVERSAL CANDLES ARE FORMED ON THE ZONE/ NEARBY THE ZONE
MIGHT GET SOME SUPPORT FROM 50 DAILY EMA OR THE GREEN ZONE(1275-1285) AND COME BACK INTO THE CHANNEL.
The indicator used:
1) Daily Lines plots Daily 20 & 50 EMA on lower time frame charts
2) TE REKAB -> PB: PULLBACK
If you like the analysis, do leave a like and follow for more such content coming up.
The analysis is my POV, hope you got bucks in your pocket to consult a financial advisor before investing :P :)
HAPPY TRADING!!
Declinazione di responsabilità
Le informazioni ed i contenuti pubblicati non costituiscono in alcun modo una sollecitazione ad investire o ad operare nei mercati finanziari. Non sono inoltre fornite o supportate da TradingView. Maggiori dettagli nelle Condizioni d'uso.
Declinazione di responsabilità
Le informazioni ed i contenuti pubblicati non costituiscono in alcun modo una sollecitazione ad investire o ad operare nei mercati finanziari. Non sono inoltre fornite o supportate da TradingView. Maggiori dettagli nelle Condizioni d'uso.