Disclaimer: This is my personal analysis for educational purposes only. I am not SEBI-registered. Please consult your financial advisor before making any trading decisions.
🔎 Weekly Chart Setup
On the weekly timeframe, when plotting Fibonacci from the bottom (below 200 EMA) to the top (above 200 EMA):
Price retraced to the 0.5 level.
After holding this zone, it is again moving towards the highs.
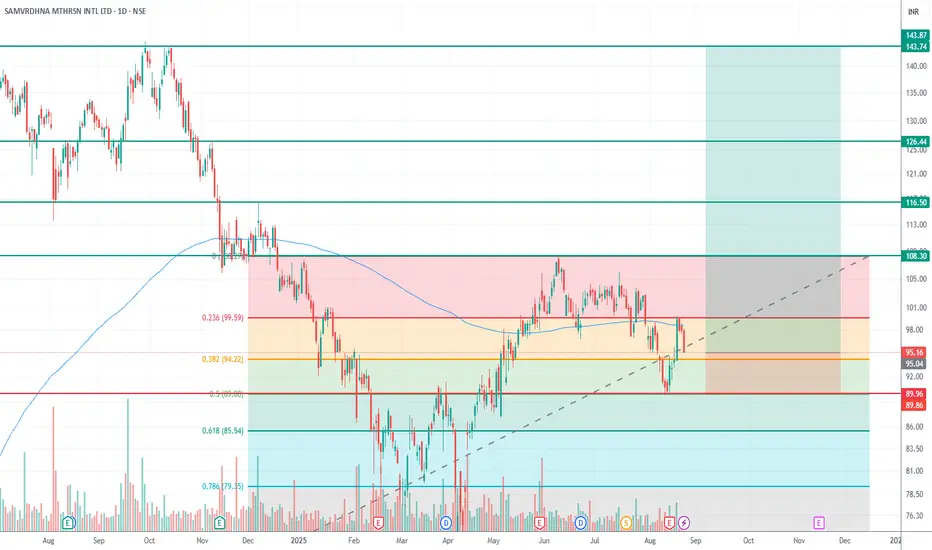
📈 Daily Chart Confirmation
Entry near CMP ~95.16.
Stop Loss: below 0.618 Fibonacci retracement → around 85 (safer SL).
Once the price crosses the first target, SL can be revised upward to the 0.5 level (~89–90).
🎯 Targets
First Target: Weekly high → 103–108
Second Target: 116
Third Target: 126
Final Target: 143
⚖️ Risk-Reward
Initial SL: 85
Entry: 95.16
Multiple profit targets with an approximate R:R > 1:5.
📌 Summary:
Weekly chart supports a bullish continuation after holding the 0.5 retracement.
The daily chart provides a clear risk-defined setup with a stop below 0.618.
Scaling out at targets and trailing SL increases the probability of locking profits.
🔎 Weekly Chart Setup
On the weekly timeframe, when plotting Fibonacci from the bottom (below 200 EMA) to the top (above 200 EMA):
Price retraced to the 0.5 level.
After holding this zone, it is again moving towards the highs.
📈 Daily Chart Confirmation
Entry near CMP ~95.16.
Stop Loss: below 0.618 Fibonacci retracement → around 85 (safer SL).
Once the price crosses the first target, SL can be revised upward to the 0.5 level (~89–90).
🎯 Targets
First Target: Weekly high → 103–108
Second Target: 116
Third Target: 126
Final Target: 143
⚖️ Risk-Reward
Initial SL: 85
Entry: 95.16
Multiple profit targets with an approximate R:R > 1:5.
📌 Summary:
Weekly chart supports a bullish continuation after holding the 0.5 retracement.
The daily chart provides a clear risk-defined setup with a stop below 0.618.
Scaling out at targets and trailing SL increases the probability of locking profits.
Trade attivo
First Target of 109 AchievedDeclinazione di responsabilità
Le informazioni e le pubblicazioni non sono intese come, e non costituiscono, consulenza o raccomandazioni finanziarie, di investimento, di trading o di altro tipo fornite o approvate da TradingView. Per ulteriori informazioni, consultare i Termini di utilizzo.
Declinazione di responsabilità
Le informazioni e le pubblicazioni non sono intese come, e non costituiscono, consulenza o raccomandazioni finanziarie, di investimento, di trading o di altro tipo fornite o approvate da TradingView. Per ulteriori informazioni, consultare i Termini di utilizzo.