MRVL Bear Flag Pattern
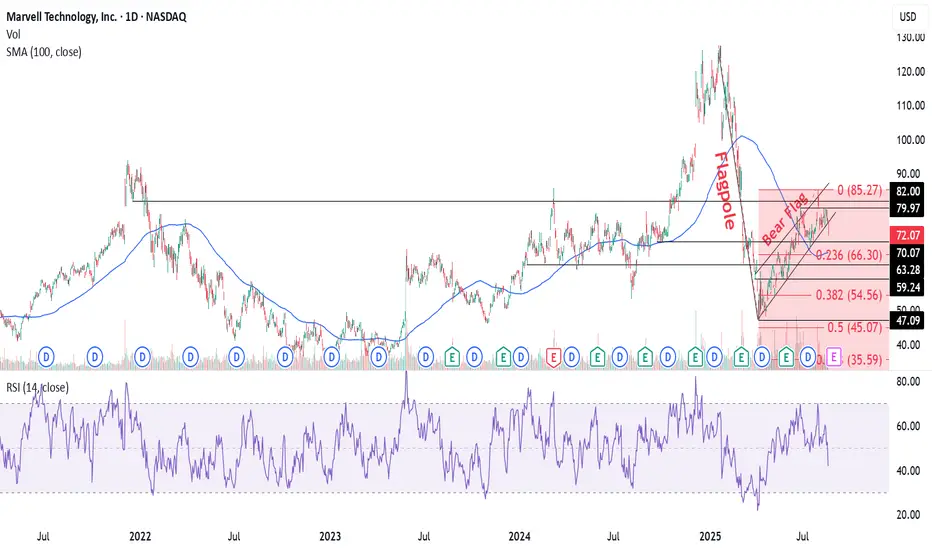
The MRVL chart indicates a bear flag formation, suggesting a continuation of the downtrend from its all-time high of $127.48 in January 2025. After hitting a low of $47.09 in April 2025, the stock consolidated between $47-$85. The recent breach below the sideways channel reflects the bear flag's flagpole, echoing the preceding downward trend.
Technical Indicators
The stock trades below its 50 DMA ($74.28) and 200 DMA ($83.13), reinforcing bearish sentiment. The daily RSI at 42 further underscores weakening momentum.
Trading Strategy
• Entry:$72-$70
• 1st Target: 100 DMA at $66.84, aligning with the 0.236 Fibonacci extension level at $66.30
• Next Targets: $63.28, $59.24, and $54.56
• Stop Loss: $80
Potential Downside
Should bearishness persist, the stock may revisit its 52-week low of $47.09, marking a significant support level.
Trade attivo
MRVL stock dropped sharply (-18.6%) on Friday's trading session as its Q3 revenue forecast of about $2.06B came in below analyst expectations of roughly $2.11B. This overshadowed strong Q2 results—revenue up 58% YoY to $2.01B and adjusted EPS of $0.67—and fueled investor disappointment, with sentiment dampened by the weaker outlook despite high hopes tied to its AI chip business.The stock has hit its initial downside targets of $66.84 and $63.28, eventually closing at $62.87. The bearish flag pattern has unfolded as expected, and it will be interesting to see how it develops further.
Declinazione di responsabilità
Le informazioni ed i contenuti pubblicati non costituiscono in alcun modo una sollecitazione ad investire o ad operare nei mercati finanziari. Non sono inoltre fornite o supportate da TradingView. Maggiori dettagli nelle Condizioni d'uso.
Declinazione di responsabilità
Le informazioni ed i contenuti pubblicati non costituiscono in alcun modo una sollecitazione ad investire o ad operare nei mercati finanziari. Non sono inoltre fornite o supportate da TradingView. Maggiori dettagli nelle Condizioni d'uso.