Overview:
Microsoft is showing a monthly Rate of Change (ROC) above 0%, while the weekly ROC is below 0%, suggesting a potential reversal zone. This setup combines trend indicators with candlestick confirmation for a high-probability entry, part of what we call the Rocket Booster Strategy.
Rocket Booster Strategy Criteria:
Candlestick Confirmation:
Daily Candle: Long lower shadow – shows buying pressure.
Hammer Pattern: Confirmed on both daily and 4-hour charts, indicating potential reversal and continuation of bullish momentum.
Entry Strategy:
Wait for the 4H chart close above the hammer confirmation level for a safer entry.
This setup leverages both momentum and trend alignment, increasing the chance of a profitable trade.
Risk Management:
Place stop-loss below the low of the daily hammer candle.
Use position sizing according to your risk tolerance.
Always practice on a demo/simulation account before trading with real money.
Key Takeaways:
Conclusion:
This MSFT setup combines trend, momentum, and candlestick analysis into the Rocket Booster Strategy. Traders should wait for proper confirmation, manage risk carefully, and consider using a simulation account first.
Rocket boost this content to learn more
Disclaimer:
This article is for educational purposes only and does not constitute financial advice. Trading stocks involves risk.
Always practice on a simulation/demo account before trading with real money, and consult a licensed financial advisor. Past performance is not indicative of future results.
Microsoft is showing a monthly Rate of Change (ROC) above 0%, while the weekly ROC is below 0%, suggesting a potential reversal zone. This setup combines trend indicators with candlestick confirmation for a high-probability entry, part of what we call the Rocket Booster Strategy.
Rocket Booster Strategy Criteria:
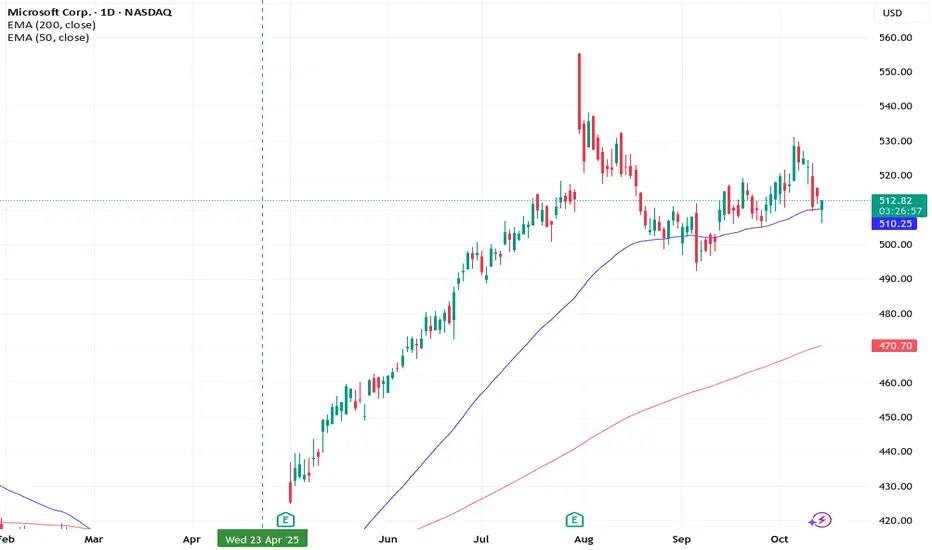
- Price is above the 50 EMA – signals short-term bullish momentum.
- Price is above the 200 EMA – confirms long-term bullish trend.
- Price has gapped up – adds momentum and increases the probability of a strong move.
Candlestick Confirmation:
Daily Candle: Long lower shadow – shows buying pressure.
Hammer Pattern: Confirmed on both daily and 4-hour charts, indicating potential reversal and continuation of bullish momentum.
Entry Strategy:
Wait for the 4H chart close above the hammer confirmation level for a safer entry.
This setup leverages both momentum and trend alignment, increasing the chance of a profitable trade.
Risk Management:
Place stop-loss below the low of the daily hammer candle.
Use position sizing according to your risk tolerance.
Always practice on a demo/simulation account before trading with real money.
Key Takeaways:
- Monthly ROC above 0% → medium-term bullish bias.
- Weekly ROC below 0% → short-term weakness, ideal for reversal.
- Alignment above 50 EMA and 200 EMA + gap-up → Rocket Booster momentum.
- Candlestick confirmation (hammer + long lower shadow) strengthens entry signal.
Conclusion:
This MSFT setup combines trend, momentum, and candlestick analysis into the Rocket Booster Strategy. Traders should wait for proper confirmation, manage risk carefully, and consider using a simulation account first.
Rocket boost this content to learn more
Disclaimer:
This article is for educational purposes only and does not constitute financial advice. Trading stocks involves risk.
Always practice on a simulation/demo account before trading with real money, and consult a licensed financial advisor. Past performance is not indicative of future results.
Pubblicazioni correlate
Declinazione di responsabilità
Le informazioni ed i contenuti pubblicati non costituiscono in alcun modo una sollecitazione ad investire o ad operare nei mercati finanziari. Non sono inoltre fornite o supportate da TradingView. Maggiori dettagli nelle Condizioni d'uso.
Pubblicazioni correlate
Declinazione di responsabilità
Le informazioni ed i contenuti pubblicati non costituiscono in alcun modo una sollecitazione ad investire o ad operare nei mercati finanziari. Non sono inoltre fornite o supportate da TradingView. Maggiori dettagli nelle Condizioni d'uso.