📊 Current Price Snapshot
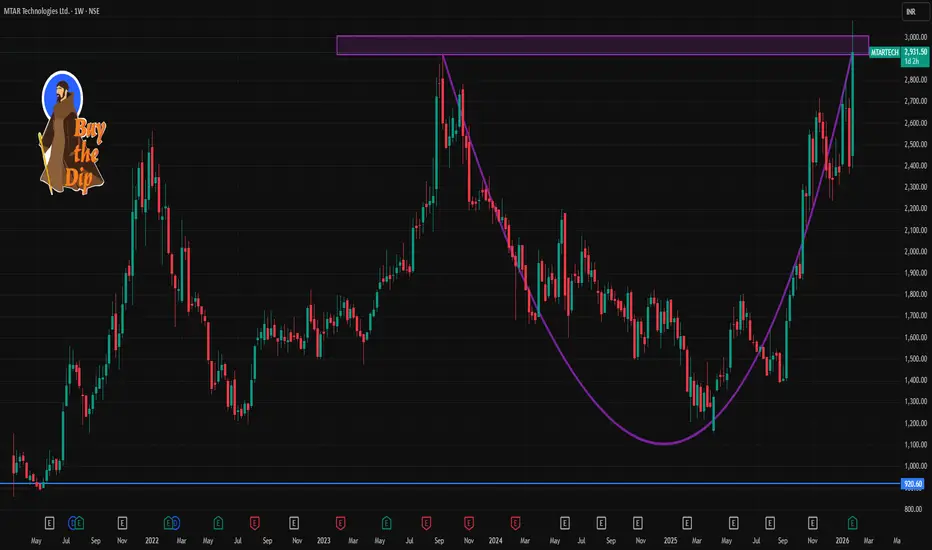
MTAR Technologies closed around ₹2,931–₹2,932 recently.
📈 Weekly Pivot & Support/Resistance Levels
(Important zones likely to act as reference over ~1 week)
🔹 Pivot Levels
These are calculated based on recent price activity and help gauge short-term bias:
Central Pivot ≈ ₹2,909–₹2,954 (key balance level)
🔹 Resistance Levels
Potential upside barriers where price may slow/reverse:
₹2,995–₹3,031 near short-term upper range
₹3,100–₹3,178 next resistance cluster
Above ₹3,200 breakout target (longer weekly/extension)
🔻 Support Levels
Important zones to watch if price pulls back:
₹2,741–₹2,762 area (S1) — near immediate short-term support
₹2,562–₹2,600 range (S2) — strong secondary support
₹2,461–₹2,500 (S3/S4) — deeper pullback zone
These resistances/supports are based on pivot point calculations & Fibonacci extensions covering multiple pivot methods.
📊 Technical Indicators (Short-Term Context)
Moving averages (20, 50, 100, 200 DMA) are largely bullish in daily/weekly analysis, supporting upward momentum.
RSI is near bullish territory but approaching overbought on shorter frames — indicating possible consolidation ahead.
Some technical tools show short-term buy signals; others show neutral — indicating range movement with upside bias.
📌 How to Use These Levels
Bullish Scenario:
➡ Price sustaining above the pivot (~₹2,890-₹2,950) suggests continuation toward ₹3,000 → ₹3,100+ resistance levels.
Bearish/Retracement Scenario:
➡ Failure below pivot or key support near ₹2,740 could trigger pullbacks toward ₹2,600 → ₹2,500 support zones.
This setup works well for 3–7 day trading or planning entry/exit zones.
Pubblicazioni correlate
Declinazione di responsabilità
Le informazioni e le pubblicazioni non sono intese come, e non costituiscono, consulenza o raccomandazioni finanziarie, di investimento, di trading o di altro tipo fornite o approvate da TradingView. Per ulteriori informazioni, consultare i Termini di utilizzo.