Technical analysis for the US 100 Cash CFD (likely the **NAS100** or a similar index) on a **4-hour timeframe**.
Here is an analysis of the key elements and the projected trade setup:
## 📈 Chart Overview
* **Asset:** US 100 Cash CFD (NAS100).
* **Timeframe:** 4-hour (4H) candles.
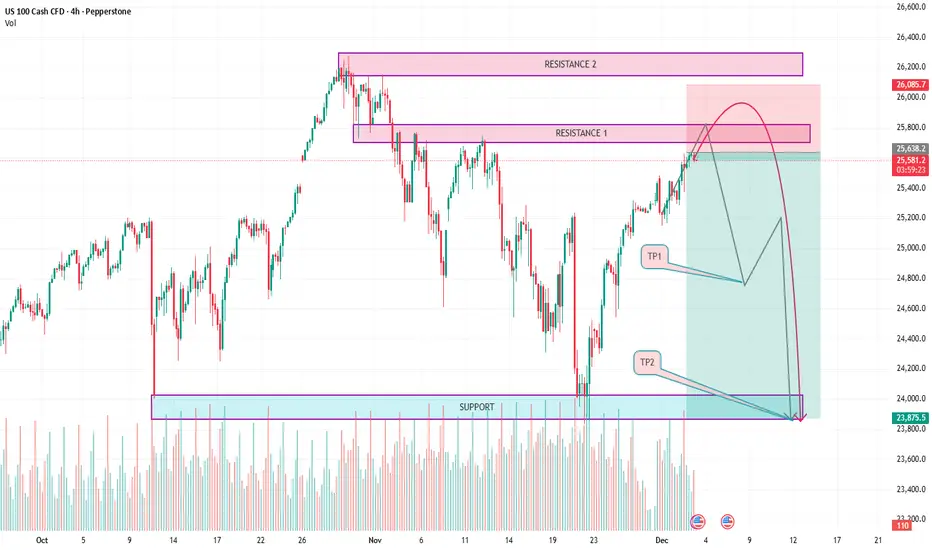
* **Current Price (as of the top left corner):** Open (O) 25,619.2, High (H) 25,638.8, Low (L) 25,568.0, Close (C) 25,570.8. The price is currently around **25,638.2**.
* **Volume:** High volatility and significant trading volume are visible at key turning points.
## 🔑 Key Levels Identified
The chart identifies three primary zones marked by horizontal boxes:
1. **Support Zone (Bottom):** A strong support level is identified between approximately **23,875.5** and **24,000**. This area marked a previous low and is the ultimate target of the projected move (TP2).
2. **Resistance 1 Zone (Middle):** An area of former resistance/support is marked around **25,700** to **25,850**. The current price is right at the top of this zone.
3. **Resistance 2 Zone (Top):** The highest resistance is identified from approximately **26,085.7** to **26,300**. This zone represents the recent peak price.
## 📉 Projected Trade Setup (Short/Sell)
The diagram illustrates a bearish or **short-selling** trade idea.
* **Trade Idea:** The general projection is a significant **downward move** from the current high area.
* **Entry Zone:** The projected entry is shown near the **Resistance 1** and slightly into the **Resistance 2** area, suggesting a wait for the price to peak out after the current rally. The proposed entry seems to be between $\text{R1}$ and $\text{R2}$, around the **25,800 - 26,000** area, where the curved path begins its descent.
* **Stop Loss (Implied):** While not explicitly marked, a stop loss would typically be placed above **Resistance 2**, perhaps slightly above the high of **26,300**.
* **Take Profit 1 (TP1):** The first target is positioned around **24,800**. This marks a moderate retracement target.
* **Take Profit 2 (TP2):** The final target is set at the main **Support Zone**, specifically at **23,875.5**.
**Projected Path:**
The chart outlines a path where the price could:
1. **Continue to rally** towards or briefly into the **Resistance 2** zone (around 26,000).
2. **Reverse sharply** (indicated by the large red curve).
3. **Descend** to **TP1** (24,800).
4. **Continue descending** to **TP2** (23,875.5) at the main support level.
Would you like me to find the current real-time price of the NAS100 or explain the concepts of support and resistance further?
Here is an analysis of the key elements and the projected trade setup:
## 📈 Chart Overview
* **Asset:** US 100 Cash CFD (NAS100).
* **Timeframe:** 4-hour (4H) candles.
* **Current Price (as of the top left corner):** Open (O) 25,619.2, High (H) 25,638.8, Low (L) 25,568.0, Close (C) 25,570.8. The price is currently around **25,638.2**.
* **Volume:** High volatility and significant trading volume are visible at key turning points.
## 🔑 Key Levels Identified
The chart identifies three primary zones marked by horizontal boxes:
1. **Support Zone (Bottom):** A strong support level is identified between approximately **23,875.5** and **24,000**. This area marked a previous low and is the ultimate target of the projected move (TP2).
2. **Resistance 1 Zone (Middle):** An area of former resistance/support is marked around **25,700** to **25,850**. The current price is right at the top of this zone.
3. **Resistance 2 Zone (Top):** The highest resistance is identified from approximately **26,085.7** to **26,300**. This zone represents the recent peak price.
## 📉 Projected Trade Setup (Short/Sell)
The diagram illustrates a bearish or **short-selling** trade idea.
* **Trade Idea:** The general projection is a significant **downward move** from the current high area.
* **Entry Zone:** The projected entry is shown near the **Resistance 1** and slightly into the **Resistance 2** area, suggesting a wait for the price to peak out after the current rally. The proposed entry seems to be between $\text{R1}$ and $\text{R2}$, around the **25,800 - 26,000** area, where the curved path begins its descent.
* **Stop Loss (Implied):** While not explicitly marked, a stop loss would typically be placed above **Resistance 2**, perhaps slightly above the high of **26,300**.
* **Take Profit 1 (TP1):** The first target is positioned around **24,800**. This marks a moderate retracement target.
* **Take Profit 2 (TP2):** The final target is set at the main **Support Zone**, specifically at **23,875.5**.
**Projected Path:**
The chart outlines a path where the price could:
1. **Continue to rally** towards or briefly into the **Resistance 2** zone (around 26,000).
2. **Reverse sharply** (indicated by the large red curve).
3. **Descend** to **TP1** (24,800).
4. **Continue descending** to **TP2** (23,875.5) at the main support level.
Would you like me to find the current real-time price of the NAS100 or explain the concepts of support and resistance further?
Daily Forex Signals & Market Insights 📉📈
Need assistance? We're here to help! 🤝
t.me/Arthur_782
Join Our Telegram Channel Today!
t.me/+3nePmmz1xGk1MzZk
t.me/+PqiIQSFLhtEyZGU0
Need assistance? We're here to help! 🤝
t.me/Arthur_782
Join Our Telegram Channel Today!
t.me/+3nePmmz1xGk1MzZk
t.me/+PqiIQSFLhtEyZGU0
Pubblicazioni correlate
Declinazione di responsabilità
Le informazioni e le pubblicazioni non sono intese come, e non costituiscono, consulenza o raccomandazioni finanziarie, di investimento, di trading o di altro tipo fornite o approvate da TradingView. Per ulteriori informazioni, consultare i Termini di utilizzo.