The breakdown of the tools and target used in your NAS100 (US Tech 100) 2h chart:
*Tools Used:*
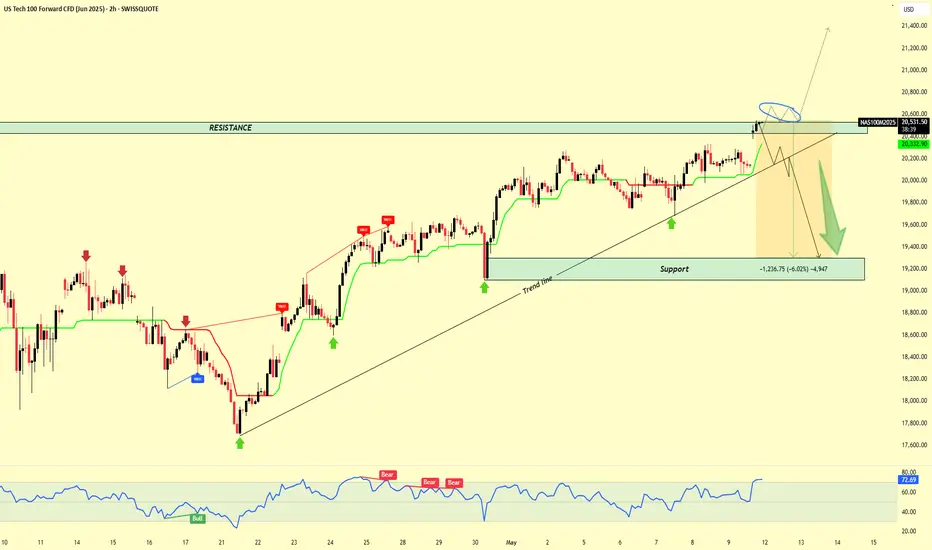
1. *Support & Resistance Zones:*
*Resistance Zone:* Highlighted near the 20,800 - 21,000 range (marked at the top).
*Support Zone:* Highlighted near 19,200 - 19,400 range (marked below).
2. *Trendline:*
* An upward sloping *trendline* connecting higher lows, indicating bullish structure until the current point.
3. *Price Action Patterns:*
*Price is approaching resistance and has formed a potential *double top / bearish rejection pattern*.
*There’s a marked area showing a possible *trendline break*.
4. *Arrow Projections:*
*Green Arrow Down:* Suggests a bearish projection after breaking below trendline & resistance rejection.
*Small Blue Arrow:* Indicates the immediate bearish move after trendline break.
5. *Volume/Indicator:*
*RSI (Relative Strength Index):* At the bottom, indicating possible overbought conditions approaching 70.
6. *ATR-like Bands / Indicators:*
*Red & green bands possibly resembling a *Keltner Channel or custom volatility band* to show dynamic S\&R.
*🎯Target Clarification:*
*Target Zone:* A bearish drop towards the *support area (19,200 - 19,400)*.
* The orange highlighted area shows a *price drop of -1,286.75 points (-6.02%)*.
* Target price mentioned around *19,420*.
*📉Summary View:*
* Price is facing strong resistance.
* Potential *trendline break confirmation*.
* *Bearish target:* \~19,400 zone.
* RSI hints at possible exhaustion in bullish momentum.
Would you like me to create a trade setup (Entry, Stop Loss, Take Profit) based on this chart?
Reply "Yes setup" if you'd like it.
*Tools Used:*
1. *Support & Resistance Zones:*
*Resistance Zone:* Highlighted near the 20,800 - 21,000 range (marked at the top).
*Support Zone:* Highlighted near 19,200 - 19,400 range (marked below).
2. *Trendline:*
* An upward sloping *trendline* connecting higher lows, indicating bullish structure until the current point.
3. *Price Action Patterns:*
*Price is approaching resistance and has formed a potential *double top / bearish rejection pattern*.
*There’s a marked area showing a possible *trendline break*.
4. *Arrow Projections:*
*Green Arrow Down:* Suggests a bearish projection after breaking below trendline & resistance rejection.
*Small Blue Arrow:* Indicates the immediate bearish move after trendline break.
5. *Volume/Indicator:*
*RSI (Relative Strength Index):* At the bottom, indicating possible overbought conditions approaching 70.
6. *ATR-like Bands / Indicators:*
*Red & green bands possibly resembling a *Keltner Channel or custom volatility band* to show dynamic S\&R.
*🎯Target Clarification:*
*Target Zone:* A bearish drop towards the *support area (19,200 - 19,400)*.
* The orange highlighted area shows a *price drop of -1,286.75 points (-6.02%)*.
* Target price mentioned around *19,420*.
*📉Summary View:*
* Price is facing strong resistance.
* Potential *trendline break confirmation*.
* *Bearish target:* \~19,400 zone.
* RSI hints at possible exhaustion in bullish momentum.
Would you like me to create a trade setup (Entry, Stop Loss, Take Profit) based on this chart?
Reply "Yes setup" if you'd like it.
Declinazione di responsabilità
Le informazioni ed i contenuti pubblicati non costituiscono in alcun modo una sollecitazione ad investire o ad operare nei mercati finanziari. Non sono inoltre fornite o supportate da TradingView. Maggiori dettagli nelle Condizioni d'uso.
Declinazione di responsabilità
Le informazioni ed i contenuti pubblicati non costituiscono in alcun modo una sollecitazione ad investire o ad operare nei mercati finanziari. Non sono inoltre fornite o supportate da TradingView. Maggiori dettagli nelle Condizioni d'uso.