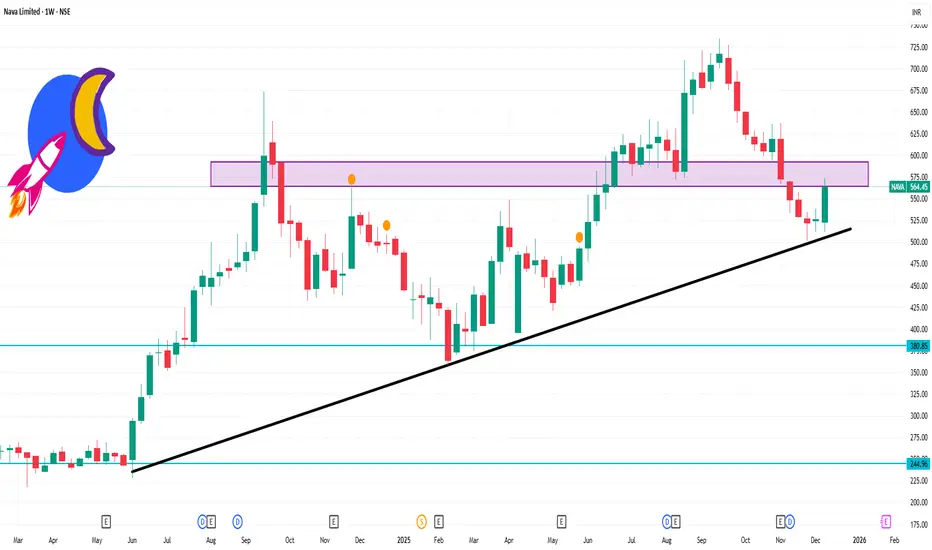
📌 Current Price Snapshot
Last traded / recent price: ~₹560–₹567 on NSE/BSE (varies by source; live changes intraday)
52‑week range: ₹356 (low) to ₹735 (high)
📊 Weekly Timeframe Levels (Support & Resistance)
For a 1‑week (weekly candle) view you want levels that matter over the entire trading week — not just intraday:
🔹 Weekly Pivot & Key Levels (from pivot and technical sources)
Immediate Pivot (weekly): ~₹552–₹563
Weekly Resistance Zones:
R1: ~₹566–₹570 (near recent swing highs)
R2: ~₹587–₹590 zone
R3: ~₹600+ if momentum persists
Weekly Support Zones:
S1: ~₹531–₹535 (first strong support)
S2: ~₹517–₹520 (secondary weekly support)
S3: ~₹496–₹500 (deeper support if selling extends)
Summary of weekly levels:
📈 Bullish break‑above: ₹570–₹590
🧊 Neutral pivot zone: ₹552–₹565
🛑 Bearish below: ₹531 → ₹500
Pubblicazioni correlate
Declinazione di responsabilità
Le informazioni e le pubblicazioni non sono intese come, e non costituiscono, consulenza o raccomandazioni finanziarie, di investimento, di trading o di altro tipo fornite o approvate da TradingView. Per ulteriori informazioni, consultare i Termini di utilizzo.