Short
NCASH/BTC Daily (Ascending Triangle)
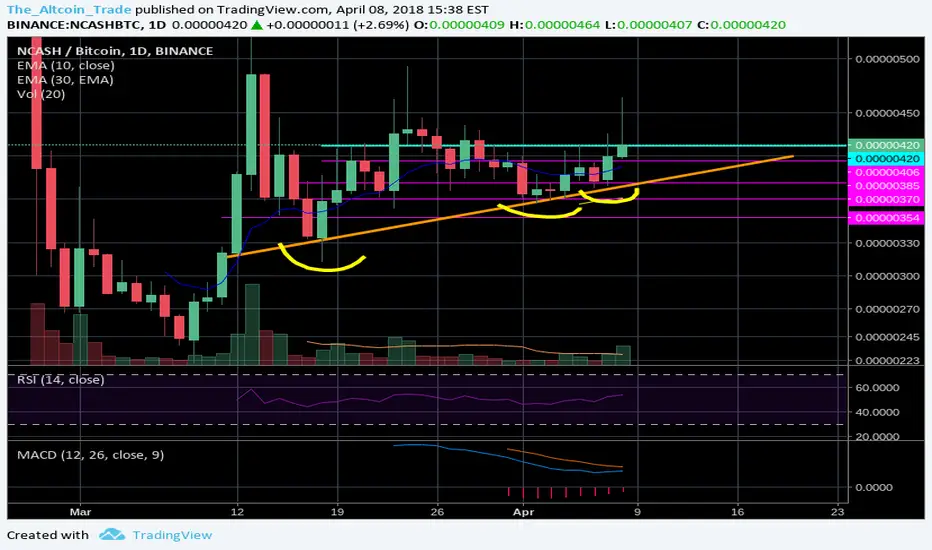
Daily Chart looks to be tightening up.
420 sats is that former resistance/now support level where the price keeps dropping to after pushing past it a few weeks ago.
That being said, higher low's are being formed. I expect a move within the next week to the upside.
420 sats is that former resistance/now support level where the price keeps dropping to after pushing past it a few weeks ago.
That being said, higher low's are being formed. I expect a move within the next week to the upside.
Nota
The 4hr Chart has the candle bouncing off of the 30 EMA. Keep eyes on the volume.Declinazione di responsabilità
Le informazioni ed i contenuti pubblicati non costituiscono in alcun modo una sollecitazione ad investire o ad operare nei mercati finanziari. Non sono inoltre fornite o supportate da TradingView. Maggiori dettagli nelle Condizioni d'uso.
Declinazione di responsabilità
Le informazioni ed i contenuti pubblicati non costituiscono in alcun modo una sollecitazione ad investire o ad operare nei mercati finanziari. Non sono inoltre fornite o supportate da TradingView. Maggiori dettagli nelle Condizioni d'uso.