Hi,
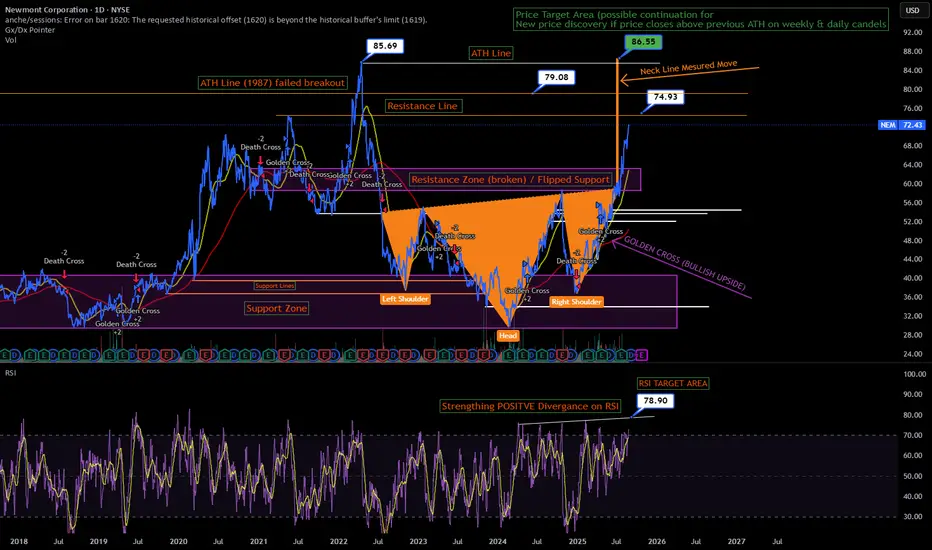
I actually spotted this a while ago and have keep this on the quiet but i am excited to share my first publication, This represents a clear "Ascending Inverse Head and Shoulders" with a slight favor to the upside.
I have set some price targets around potential Resistance levels also there was a double top since 1987 where if broken a harder move higher is likely to align with the Neckline measured move, Time wise i believe this will finish some time in Late November to early February in 2026.
Look to a pullback in RSI to see when the bullish buying and strength fades away but it will be excellent to see a conformation with some closes above the previous ATH on the 1 day or weekly candle charts. the golden Cross moving averages are with the 50 day vs the 200 day cross over indicating that a bullish golden cross is in full effect, i expect the measured move to complete along side some minor pull backs around the resistance levels, those dips should be brought into with strategic profit taking around the key levels, I wouldn't say exit NEM after completion more profit take and remain cautious until conformation of a new confirmed ATH breakout. 2026 could see a continuation grind to new heights around $100+ per share but will need to reinvestigate the double top breakout once played out after EOY.
Regards R.
Declinazione di responsabilità
Le informazioni e le pubblicazioni non sono intese come, e non costituiscono, consulenza o raccomandazioni finanziarie, di investimento, di trading o di altro tipo fornite o approvate da TradingView. Per ulteriori informazioni, consultare i Termini di utilizzo.
Declinazione di responsabilità
Le informazioni e le pubblicazioni non sono intese come, e non costituiscono, consulenza o raccomandazioni finanziarie, di investimento, di trading o di altro tipo fornite o approvate da TradingView. Per ulteriori informazioni, consultare i Termini di utilizzo.