📘 NFLX 2009–2029 Descriptive Analysis
This is a detailed Elliott Wave Theory-based outlook for Netflix (NFLX) stock from around 2009 to the projected future of 2029, and it incorporates Fibonacci retracement & extensions, Smart Money Concepts (SMC), and Price Action structure within a channel.
Let’s break this down chronologically and structurally:
🌀 Wave Theory Confluence (Elliott Wave Structure)
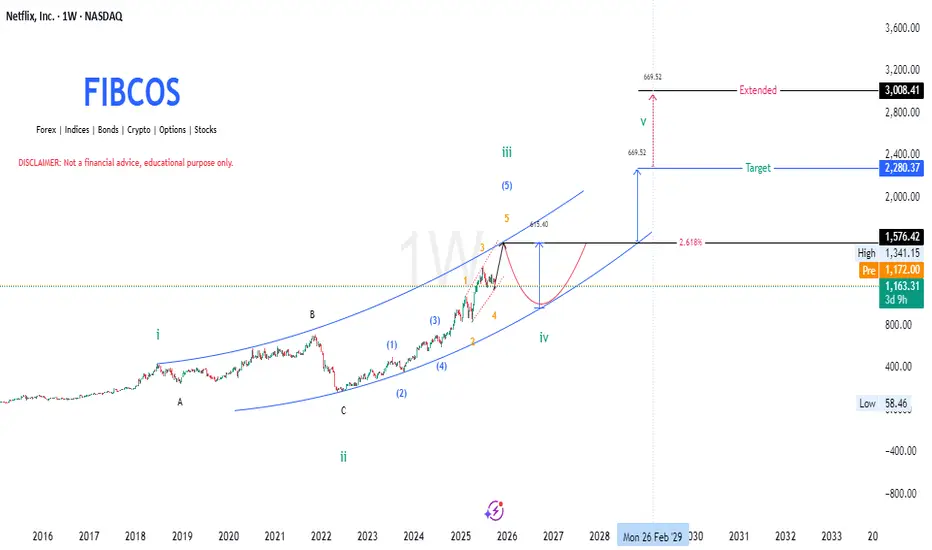
The long-term structure of Netflix (NFLX) from 2009 to the projected 2029 period follows a classic Elliott Wave cycle, now realigned with the cycle top in mid-2018 and the macro correction ending in mid-2022.
1. Cycle Wave i (2009–2018):
NFLX entered a powerful multi-year rally, forming five sub-waves within this first major impulse. This long rally ended in mid-2018, marking the top of Cycle Wave i.
2. Cycle Wave ii – ABC Correction (2018–2022):
From the 2018 top, the price entered a prolonged and complex 4-year correction, unfolding as a classic A-B-C corrective structure.
This phase aligns with a major redistribution cycle where smart money exited positions, and retail investors were caught in hope rallies.
3. Cycle Wave iii (2022–2025):
After finding a bottom in mid-2022, the stock launched a new impulsive rally, forming five sub-waves (1–5) of a powerful Wave iii
4. Cycle Wave iv (Expected 2025–2027):
A corrective wave iv is expected to unfold, possibly returning toward the lower bound of the long-term ascending channel.
According to the principle of alternation, since wave ii was deep and complex, wave iv may be shallower or more sideways.
5. Cycle Wave v (Expected 2027–2029):
After the wave iv correction, a final impulsive leg — Wave v — is expected to push the price higher, targeting around $2,280.37, with a potential extended move to $3,008.41.
This will complete the macro 5-wave cycle that began in 2009.
📐 Fibonacci Confluence
The Fibonacci structure supports these wave formations:
Fibonacci tools confirm that price has behaved symmetrically within the wave cycles, and provide high-probability zones for both correction and expansion.
🧠 Smart Money Concept (SMC)
From a Smart Money perspective, the chart reflects a complete institutional cycle:
Smart Money Concepts help explain the why behind each wave: fear and euphoria don’t happen randomly — they are often orchestrated phases of value transfer.
📊 Price Action Structure
The long-term price action of NFLX reinforces the wave count and market psychology:
This structure shows how technical behavior mirrors emotional and fundamental phases — from greed to fear, and back again.
📆 Timeline Summary (2009–2029)
🔚 Conclusion
With the cycle top revised to mid-2018 and the correction ending mid-2022, the chart structure becomes even more aligned with classic Elliott Wave theory and Smart Money behavior.
Netflix’s long-term chart is a perfect confluence of:
The roadmap to 2029 shows exciting bullish potential, but also highlights the need for caution near projected macro top zones — where institutional distribution may quietly unfold again.
📘 DISCLAIMER: This is a structural, educational market outlook. Not financial advice. Please do your own due diligence and risk management.
#Netflix, #NFLX, #Nasdaq #WaveTheory, #Fibonacci, #SmartMoney, #PriceAction
This is a detailed Elliott Wave Theory-based outlook for Netflix (NFLX) stock from around 2009 to the projected future of 2029, and it incorporates Fibonacci retracement & extensions, Smart Money Concepts (SMC), and Price Action structure within a channel.
Let’s break this down chronologically and structurally:
🌀 Wave Theory Confluence (Elliott Wave Structure)
The long-term structure of Netflix (NFLX) from 2009 to the projected 2029 period follows a classic Elliott Wave cycle, now realigned with the cycle top in mid-2018 and the macro correction ending in mid-2022.
1. Cycle Wave i (2009–2018):
NFLX entered a powerful multi-year rally, forming five sub-waves within this first major impulse. This long rally ended in mid-2018, marking the top of Cycle Wave i.
2. Cycle Wave ii – ABC Correction (2018–2022):
From the 2018 top, the price entered a prolonged and complex 4-year correction, unfolding as a classic A-B-C corrective structure.
- Wave A began the decline with a sharp markdown.
- Wave B was a fake recovery, leading to Wave C, a deeper liquidation into mid-2022, completing the correction.
This phase aligns with a major redistribution cycle where smart money exited positions, and retail investors were caught in hope rallies.
3. Cycle Wave iii (2022–2025):
After finding a bottom in mid-2022, the stock launched a new impulsive rally, forming five sub-waves (1–5) of a powerful Wave iii
- Momentum accelerated in wave 3 of iii (typical in Elliott Wave), and the structure is now peaking as of late 2025, around $1,576.42.
- This marks the expected completion of Wave iii, with signals pointing toward a correction.
4. Cycle Wave iv (Expected 2025–2027):
A corrective wave iv is expected to unfold, possibly returning toward the lower bound of the long-term ascending channel.
According to the principle of alternation, since wave ii was deep and complex, wave iv may be shallower or more sideways.
5. Cycle Wave v (Expected 2027–2029):
After the wave iv correction, a final impulsive leg — Wave v — is expected to push the price higher, targeting around $2,280.37, with a potential extended move to $3,008.41.
This will complete the macro 5-wave cycle that began in 2009.
📐 Fibonacci Confluence
The Fibonacci structure supports these wave formations:
- The 2.618 extension of the previous impulse wave (measured from the 2022 bottom) projects a price target near $2,280.37, aligning with historical extension zones.
- The extended target at $3,008.41 aligns with the upper boundary of the long-term channel — often reached during euphoric final waves.
- Prior retracements during wave ii and the anticipated retracement in wave iv fall into common Fibonacci pullback zones (0.382–0.618).
Fibonacci tools confirm that price has behaved symmetrically within the wave cycles, and provide high-probability zones for both correction and expansion.
🧠 Smart Money Concept (SMC)
From a Smart Money perspective, the chart reflects a complete institutional cycle:
- Distribution Zone (2017–2018):
Smart money exited during the late stages of Cycle Wave i. This aligns with the cycle top in mid-2018, often accompanied by overvaluation and high optimism. - Re-Accumulation Phase (2018–2022):
The 4-year correction allowed institutional players to accumulate at discounted prices during wave C. Retail was largely shaken out, and liquidity was swept multiple times. - Expansion Phase (2022–2025):
From the 2022 bottom, price moved sharply upward in a clean impulse (Wave iii), confirming institutional interest. Gaps, strong breakouts, and efficient trends reflected low-resistance expansion driven by smart money. - Future Distribution (2029?):
Around the projected $2,280–$3,008 range (Wave v), expect distribution signs—including deviation from trend, order block mitigation, and liquidity grabs. These are typical before a larger market reset.
Smart Money Concepts help explain the why behind each wave: fear and euphoria don’t happen randomly — they are often orchestrated phases of value transfer.
📊 Price Action Structure
The long-term price action of NFLX reinforces the wave count and market psychology:
- 2009–2018 (Wave i):
Price action showed a steady trend of higher highs and higher lows, with smooth breakouts and momentum-driven runs. - 2018–2022 (Wave ii correction):
A breakdown in structure occurred. Lower highs and a wide, overlapping correction defined this multi-year distribution. Key support levels were breached and retested as resistance — a classic bearish shift in structure. - 2022–2025 (Wave iii):
Clean, impulsive movement resumed. Breakouts, bullish flags, and retests marked key continuation zones. Market structure flipped back bullish with efficient rallies. - 2025–2027 (Wave iv expected):
A retracement is likely toward previous demand zones, possibly aligning with wave 4 of the lower-degree impulse, respecting Elliott’s guideline of wave 4 often retracing to the territory of wave 4 of the previous degree. - 2027–2029 (Wave v projection):
Anticipate price pushing into new highs, with potential overextension. However, bearish divergence and slowing momentum could foreshadow the macro top.
This structure shows how technical behavior mirrors emotional and fundamental phases — from greed to fear, and back again.
📆 Timeline Summary (2009–2029)
- 2009–2018:
Powerful multi-year impulse forms Cycle Wave i, ending in mid-2018. - 2018–2022:
A deep, multi-legged ABC correction forms Cycle Wave ii, ending in mid-2022. - 2022–2025:
Explosive impulsive rally forms Cycle Wave iii, currently completing around $1,576.42. - 2025–2027 (Expected):
A corrective pullback forms Cycle Wave iv, likely more sideways or shallow in structure. - 2027–2029 (Expected):
Final rally completes Cycle Wave v, with price targets between $2,280.37 and $3,008.41, ending the macro Elliott structure.
🔚 Conclusion
With the cycle top revised to mid-2018 and the correction ending mid-2022, the chart structure becomes even more aligned with classic Elliott Wave theory and Smart Money behavior.
Netflix’s long-term chart is a perfect confluence of:
- Elliott Wave structure (impulse → correction → impulse),
- Fibonacci precision,
- Institutional manipulation (SMC), and
- Clear price action behavior.
The roadmap to 2029 shows exciting bullish potential, but also highlights the need for caution near projected macro top zones — where institutional distribution may quietly unfold again.
📘 DISCLAIMER: This is a structural, educational market outlook. Not financial advice. Please do your own due diligence and risk management.
#Netflix, #NFLX, #Nasdaq #WaveTheory, #Fibonacci, #SmartMoney, #PriceAction
Trade attivo
Market moved almost 100 points in our favor this week—strong progress toward the goal. Keep the focus sharp and the drive strong. The best is yet to come! 🔥📊"Declinazione di responsabilità
Le informazioni e le pubblicazioni non sono intese come, e non costituiscono, consulenza o raccomandazioni finanziarie, di investimento, di trading o di altro tipo fornite o approvate da TradingView. Per ulteriori informazioni, consultare i Termini di utilizzo.
Declinazione di responsabilità
Le informazioni e le pubblicazioni non sono intese come, e non costituiscono, consulenza o raccomandazioni finanziarie, di investimento, di trading o di altro tipo fornite o approvate da TradingView. Per ulteriori informazioni, consultare i Termini di utilizzo.