Henry Hub Natural Gas Future Weekly Analysis 10-14 June, 24
📈 Henry Hub Natural Gas Future Technical Chart Analysis
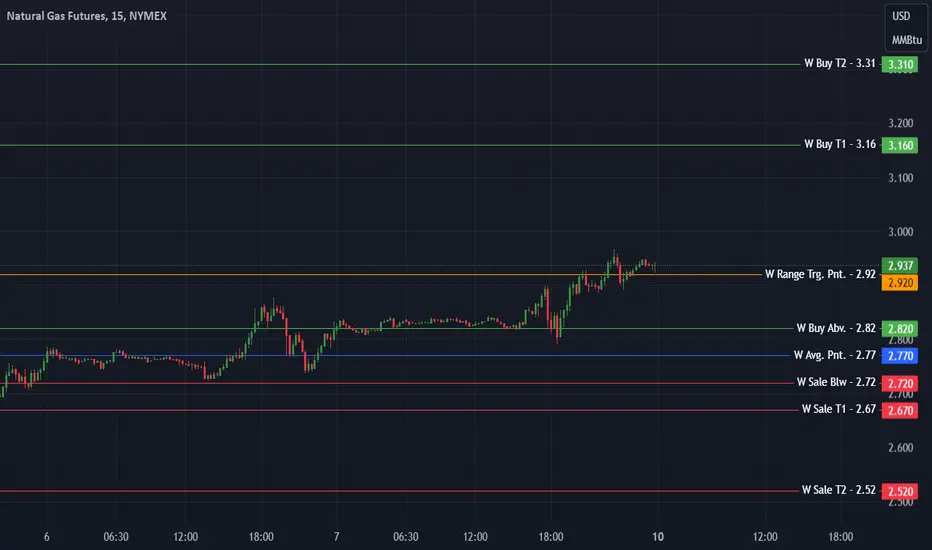
📆 Weekly Levels for 10-14 June, 2024:
📊 Weekly Movement Point: 2.92
📉 Weekly Range: 0.39
📈 Buy Above: 2.82
💼 Average At: 2.77
🎯 Buy Target 1: 3.16
🎯 Buy Target 2: 3.31
🛑 Buyer Stoploss: 2.69
💰 Sale Below: 2.72
🎯 Sale Target 1: 2.67
🎯 Sale Target 2: 2.52
🛑 Seller Stoploss: 2.85
✨ Boost, follow, and engage for more insightful updates. For detailed analysis and live discussions, check out our community channels. Your engagement fuels our dedication to providing top-notch content! 🚀❤️
#HenryHub #NaturalGas #GasFutures #CommoditiesTrading #MarketAnalysis #NG #GasPrices #NatGas #EnergyTrading #MCX #CommoditiesFutures #CommoditiesOptions
Declinazione di responsabilità
Le informazioni ed i contenuti pubblicati non costituiscono in alcun modo una sollecitazione ad investire o ad operare nei mercati finanziari. Non sono inoltre fornite o supportate da TradingView. Maggiori dettagli nelle Condizioni d'uso.
Declinazione di responsabilità
Le informazioni ed i contenuti pubblicati non costituiscono in alcun modo una sollecitazione ad investire o ad operare nei mercati finanziari. Non sono inoltre fornite o supportate da TradingView. Maggiori dettagli nelle Condizioni d'uso.